Free Sorting data analysis
Use this function to analyze free sorting data in a quick and efficient way. Available in Excel with the XLSTAT software.

What is Free Sorting data analysis?
Free Sorting tests are becoming more and more popular as part of the sensory characterization of products. They are easy to build and easy to answer. The principle is as follows: each participant is asked to group the products presented to him/her. Each cluster thus represents a set of products that are very similar for the assessor who built it. The number of groups is chosen by the participant. The only prohibited action is to put all products in the same group and to make as many groups as products.
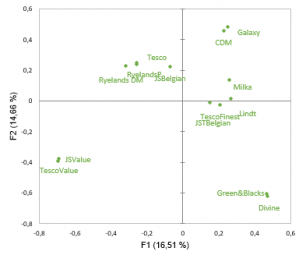
The main objective of Free Sorting data analysis is to study and visualize the links between products as well as to study the agreements between the assessors.
Options for Free Sorting data analysis in XLSTAT
Three methods are available for analyzing free sorting data:
STATIS: Data pre-processing is carried out in order to use the STATIS method. Data pre-processing consists of considering each assessor as a complete disjunctive table, where group sizes are then standardized (Llobell, Cariou, Vigneau, Labenne & Qannari, 2020). The STATIS method allows to have indicators of agreement between assessors and to take account of them in the analysis.
CA on the co-occurrence matrix: a product co-occurrence matrix is build, followed by a Correspondence Analysis (Cariou & Qannari, 2018).
MCA: Multiple Correspondence Analysis is performed on the row data (Van der Kloot & Van Herk, 1991).
Another objective is to analyze assessors proximities. For this purpose, a co-occurrence matrix between the assessors is build, followed by a Correspondence Analysis (Cariou & Qannari, 2018).
Filter factors: You can activate one of the following two options in order to reduce the number of factors for which results are displayed.
- Minimum %: Enter the minimum percentage of the total variability that the chosen factors must represent.
- Maximum Number: Set the number of factors to take into account.
Results for Free Sorting data analysis
Various results are displayed depending on the method used (STATIS, CA or MCA) such as:
- Eigenvalues and percentages of inertia
- Consensus coordinates
- RV matrix
- Scaling factor for each assessor
- Weight of each assessor
- Consensus configuration
- Homogeneity
- RV index between each assessor and the consensus
- Global error
- Residual per assessor
- Residual per product


analice sus datos con xlstat
Incluido en
Productos relacionados