Welch and Brown-Forsythe one-way ANOVA
Welch and Brown-Forsythe ANOVA are more reliable than the classic F when variances are unequal. Both are available in Excel using the XLSTAT software.

The analysis of variance (ANOVA) allows to determine whether a factor, also called explanatory variable, has a significant effect on a dependent variable. For example, we may test the effects of a factor involving 4 medical treatments on blood pressure. Running a one-way ANOVA on the data would answer the question: “is there at least one treatment which significantly differs from the others?
Principles of the Analysis of Variance
Analysis of variance (ANOVA) is a tool used to partition the observed variance in a particular variable into components attributable to different sources of variation.
Analysis of variance (ANOVA) uses the same conceptual framework as linear regression. The main difference comes from the nature of the explanatory variables: instead of quantitative, here they are qualitative. In anova, explanatory variables are often called factors.
When to use the Welch and the Brown-Forsythe ANOVA
Fisher's classic One-Way ANOVA assumes that the variances among groups/samples are homogeneous. In other words, that groups have equal variances. It may happen that this condition is violated when the groups' variances cannot be assumed to be equal. In this case, the F test of the ANOVA is not robust enough to be used and results will be invalid.
XLSTAT offers two alternative tests based on the F distribution but more robust than the classical F test.
These tests are:
- Welch Test or Welch ANOVA (Welch, 1951). The Welch test adjusts the denominator of the F ratio so it has the same expectation as the numerator when the null hypothesis is true, despite the heterogeneity of within-group variance. The p-value can be interpreted in the same manner as in the analysis of variance table.
- The Brown-Forsythe test or Brown-Forsythe F-ratio (1974). This test uses a different denominator for the formula of F in the ANOVA. Instead of dividing by the mean square of the error, the mean square is adjusted using the observed variances of each group. The p-value can be interpreted in the same manner as in the analysis of variance table.
A Levene's test is available to run a test on the homogeneity of variances in XLSTAT. The test is run to compare for each factor, the variance of the different categories.
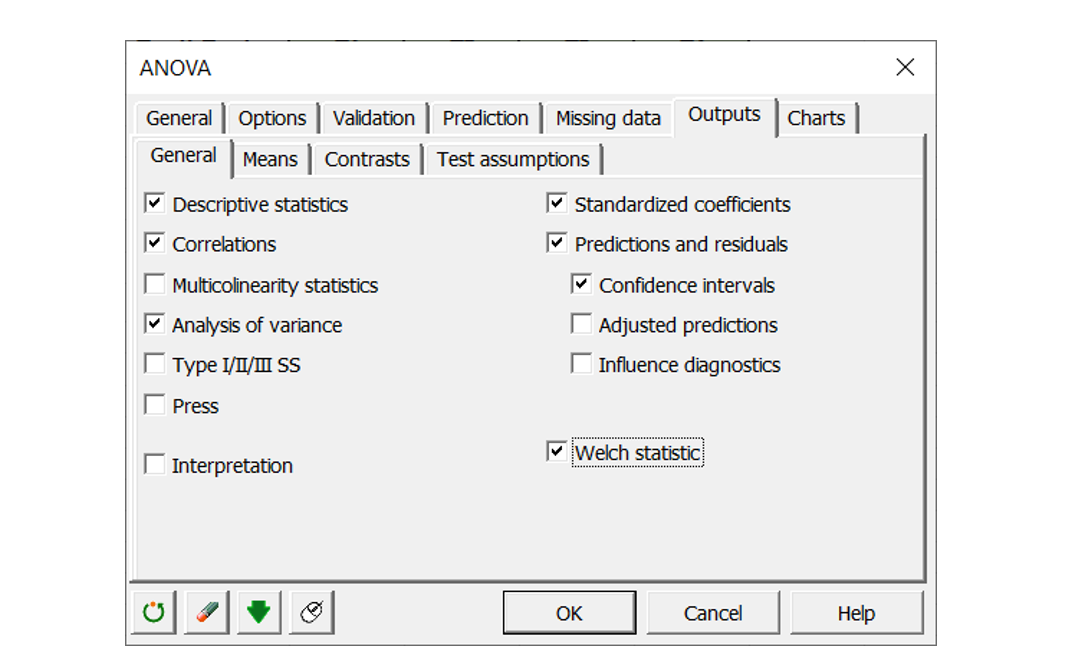
Options for Welch and the Brown-Forsythe tests in XLSTAT
XLSTAT offers an option in the ANOVA dialog box. You just need to activate to display the Welch and Brown-Forsythe tests in the case of a one-way ANOVA.
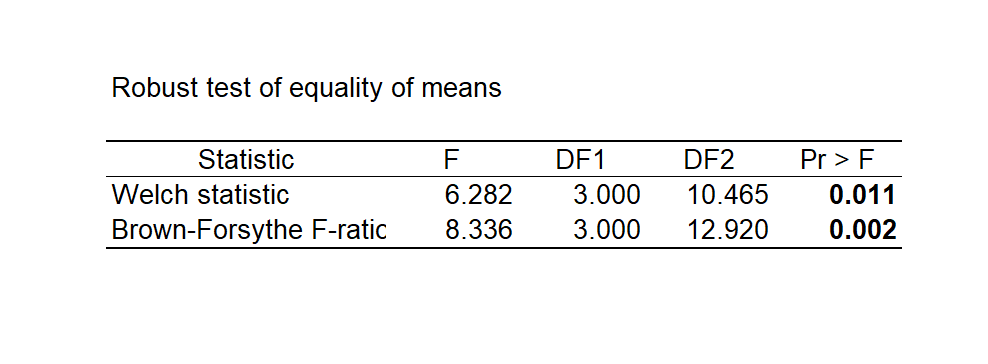
Results for Welch and the Brown-Forsythe tests in XLSTAT
A table is displayed providing the F Welch statistic, the Brown-Forsythe F-ratio, the respective degrees of liberties and p-values.
Multiple comparison test for unequal variances in XLSTAT
One of the main applications of ANOVA is multiple comparisons testing whose aim is to check if the parameters for the various categories of a factor differ significantly or not. Once we identify a significant difference, we may want to know what categories differ from one another. This question requires testing the differences between all pairs of treatments. Numerous tests have been proposed for comparing the means of pairwise grous.
The Games-Howell (GH) test can be used in one-way ANOVAs when the variances lack of homogeneity. While it can be used with unequal sample sizes, it is recommended to use it when the smallest sample has 5 elements or more, otherwise it is too liberal.


analyze your data with xlstat
Related features