Mixed models
Mixed models take into account both fixed and random effects in a single model. Available in Excel using the XLSTAT add-on statistical software.

Principles of Mixed models
Mixed models are complex models based on the same principle as general linear models, such as the linear regression. They make it possible to take into account, on the one hand, the concept of repeated measurement and, on the other hand, that of random factor. The explanatory variables could be as well quantitative as qualitative. Mixed models can be used to carry out repeated measures ANOVA.
Mixed models equation
A mixed model is written as follows:
y = Xβ + Zγ + ε
where y is the dependent variable, X gathers all fixed effects (these factors are the classical OLS regression variables or the ANOVA factors), β is a vector of parameters associated with the fixed factors, Z is a matrix gathering all the random effects (factors that cannot be set as fixed), γ is a vector of parameters associated with the random effects and ε is an error vector.
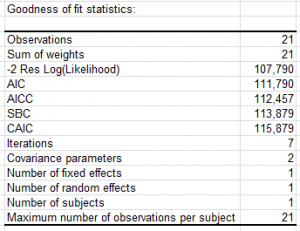
Parameters are estimated using the maximum likelihood estimator. XLSTAT propose different covariance matrix between the errors within the framework of mixed models.
In addition, the interactions to be used in the model can be easily defined in XLSTAT.
Results for Mixed models in XLSTAT
XLSTAT allows computing the type I, II and III tests of the fixed effects. The principle of these tests is the same one as in the case of the linear model. Nevertheless, their calculation differs slightly.
As in classical ANOVA, in repeated measures ANOVA multiple comparisons can be performed. It is aimed at checking whether the various categories of a factor differ significantly or not. For example, in the case where four treatments are applied to plants, we want to know not only if the treatments have a significant effect, but also if the treatments have different effects. Numerous tests have been proposed for comparing the means of categories.
The majority of these tests assume that the sample is normally distributed. XLSTAT provides the main tests. In the case of repeated measures ANOVA, standard deviations are obtained using the maximum likelihood estimates.


analyze your data with xlstat
Related features