ANOVA (Analysis of variance)
Use this model to carry out ANOVA (ANalysis Of VAriance) of one or more balanced or unbalanced factors. Available in Excel with the XLSTAT software.

Principles of the Analysis of Variance
Analysis of variance (ANOVA) is a tool used to partition the observed variance in a particular variable into components attributable to different sources of variation.
Analysis of variance (ANOVA) uses the same conceptual framework as linear regression. The main difference comes from the nature of the explanatory variables: instead of quantitative, here they are qualitative. In ANOVA, explanatory variables are often called factors.
Depending on the number of factors, you can run a one-way ANOVA test but also a two-way ANOVA or even a repeated measures ANOVA. A one-way ANOVA has one explanatory variable while a two-way ANOVA has two and so on. In all cases, the ANOVA’s null hypothesis is that the variance of the dependent variable does not vary depending on the factor modalities.
If the null hypothesis cannot be accepted, we can conclude that the factors significantly influence the values of the dependent variable.
Not sure whether ANOVA is adapted to your data? Still, wondering when to use an ANOVA? Check out our guide to choosing the right modeling tool according to your situation.
What is an ANOVA model?
If p is the number of factors, the anova model is written as follows:
yi = β0 + ∑j=1...p βk(i,j),j + εi
where yi is the value observed for the dependent variable for observation i, k(i,j) is the index of the category (or level) of factor j for observation i and εiis the error of the model.
The chart below shows data that could be analyzed using a 1-factor ANOVA. The factor has three categories. Data are orange points. The dashed green line is the grand mean and the short green lines are category averages. Note that we use arbitrarily the sum(ai)=0 constraint, which means that β0 corresponds to the grand mean.

We need to verify two main assumptions in ANOVA. The hypotheses used in ANOVA are identical to those used in linear regression: the errors εifollow the same normal distribution N(0,s) and are independent. It is recommended to check retrospectively that the underlying hypotheses have been correctly verified. The hypothesis of normality of can be checked by analyzing certain charts on residues or by using a normality test. The independence of the residues can be checked by analyzing certain charts or by using the Durbin Watson test.
Data selection in XLSTAT
Typically, in order to run an analysis in XLSTAT, you need to enter each variable in a single column.
However, the XLSTAT ANOVA tool allows you to select the data in two different ways when having up to three factors (explanatory variables):
- Select a single column of values for each variable (dependent and factors).
- Select a grouped data table where rows categorize the data according to one factor, and columns categorize them according to the other factors.
Options for setting up an ANOVA in XLSTAT
- XLSTAT enables you to perform one and multiple-way ANOVA. Interactions up to order 4 can be included in the model as well as nested and random effects.
- XLSTAT can handle both balanced and unbalanced ANOVA.
- XLSTAT has an automatic device to find nested factors and one nested factor can be included in the model.
- Random factors can be included in an ANOVA analysis. When some factors are supposed to be random, XLSTAT displays the expected mean squares table.
- Four methods are proposed for model selection: Best model, Stepwise, Forward, Backward
- Test assumptions: a Shapiro-Wilk test is performed on the residuals. A Levene's test is available to run a test on the homogeneity of variances. The test is run to compare each factor, and the variance of the different categories.
When ANOVA conditions are not met: how to check ANOVA assumptions?
XLSTAT allows to correct for heteroscedasticity and autocorrelation that can arise using several methods such as the estimator suggested by Newey and West (1987).
Homoscedasticity and independence of the error terms are key hypotheses in linear regression and ANOVA where it is assumed that the variances of the error terms are independent and identically distributed and normally distributed. When these assumptions are not possible to keep (a Durbin Watson or White test available in the Time series menu allows to challenge these hypotheses), a consequence is that the covariance matrix cannot be estimated using the classical formula, and the variance of the parameters corresponding to the coefficients of the linear model can be wrong and their confidence intervals as well. A predictor could be said to be significant (or respectively not) while being the opposite. XLSTAT allows to correct for heteroscedasticity and autocorrelation that can arise, especially in time series.
For what concerns heteroscedasticity, White (1980) followed by several authors has explored ways to correct the classical estimate of the covariances using residuals and centered leverages obtained from the linear regression computations (see MacKinnon (1985) and Zeileis (2006) for a review).
Multiple comparisons tests after ANOVA
One of the main applications of ANOVA is multiple comparison testing whose aim is to check if the parameters for the various categories of a factor differ significantly or not. For example, in the case where four treatments are applied to plants, we want to know not only if the treatments have a significant effect, but also if the treatments have different effects.
Numerous tests have been proposed for comparing the means of groups. The majority of these tests assume that the sample is normally distributed.
Results for the analysis of variance in XLSTAT
The results given are a residuals analysis, parameters of the models, the model equation, the standardized coefficients, Type I SS, Type III SS, and predictions are displayed.
In addition, several multiple comparison methods, also called post-hoc tests, can optionally be performed: Bonferroni's and Dunn-Sidak corrected t-test, Tukey's HSD test, Fisher's LSD test, Duncan's test, Newman-Keuls' (SNK) method and the REGWQ method. Also, the Dunnett's test is available to allow users to perform multiple comparisons with control (MCC) and multiple comparisons with the best (MCB). The Games-Howell (GH) test can be used in one-way ANOVAs when the variances lack of homogeneity. While it can be used with unequal sample sizes, it is recommended to use it when the smallest sample has 5 elements or more, otherwise, it is too liberal.
Moreover, influence diagnostics are displayed for each observation including the residual, the standardized residual (divided by the RMSE), the studentized residual, the deleted residual, the studentized deleted residual, thee leverage, the Mahalanobis distance, the Cook's D, the CovRatio, the DFFit, the standardized DFFit, the DFBetas (one per model coefficient) and the standardized DFBetas.
Among the proposed charts in the analysis of variance in XLSTAT
- Standardized coefficients chart: The bar chart displays the values and confidence intervals of the standardized coefficients.

- Regression chart: The chart shows the observed values, the regression line and both types of confidence interval around the predictions.
- Standardized residuals as a function of model predictions: In principle, the residuals should be distributed randomly around the X-axis. If there is a trend or a shape, this shows a problem with the model.

- The distance between the predictions and the observations: For an ideal model, the points would all be on the bisector.
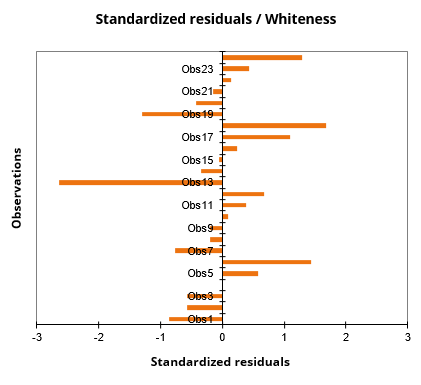
- The standardized residuals on a bar chart: The last chart quickly shows if an abnormal number of values are outside the interval]-2, 2[ given that the latter, assuming that the sample is normally distributed, should contain about 95% of the data.
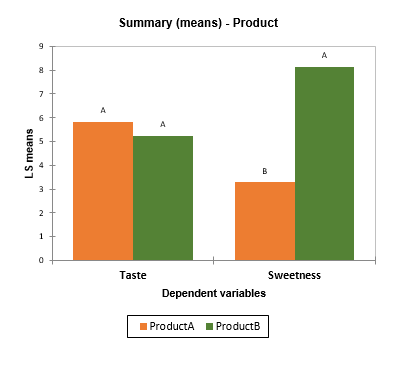
- Summary charts: If several dependent variables have been selected and if the multiple comparisons option has been activated, a chart allows to visualize estimated means with multiple comparisons grouping letters.
What is ANOVA used for in the real world?
Examples of real-world applications are available on our website:
- How to measure the effect of new toothpaste formulas on the whiteness of teeth.
- How to identify whether there are significant differences in terms of sweetness for different products evaluated by different panelists.
- How to measure the effect of microwave brand, its power, and cooking time on the percentage of edible pop corn.


analyze your data with xlstat
Related features