Normality tests
Normality tests check if a population significantly differs from a normal distribution. Available in Excel with the XLSTAT add-on statistical software.

What are normality tests
Assuming a sample is normally distributed is common in statistics. But checking that this is actually true is often neglected. For example, the normality of residuals obtained in linear regression is rarely tested, even though it governs the quality of the confidence intervals surrounding parameters and predictions. Normality tests are associated to the null hypothesis that the population from which a sample is extracted follows a normal distribution. So when the p-value linked to a normality test is lower than the risk alpha, the corresponding distribution is significantly not-normal.
Normality tests in XLSTAT
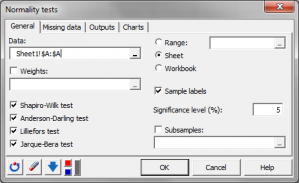
XLSTAT offers four tests for testing the normality of a sample:
- The Shapiro-Wilk test This test is best suited to samples of less than 5000 observations;
- The Anderson-Darling test This test proposed by Stephens (1974) is a modification of the Kolmogorov-Smirnov test and is suited to several distributions including the normal distribution for cases where the parameters of the distribution are not known and have to be estimated;
- The Lilliefors test This test is a modification of the Kolmogorov-Smirnov test and is suited to normal cases where the parameters of the distribution, the mean and the variance are not known and have to be estimated;
- The Jarque-Bera test This test is more powerful the higher the number of values.
Plots associated to the Normality tests
In order to check visually if a sample follows a normal distribution, it is possible to:
- P-P Plots (normal distribution) P-P plots (for Probability-Probability) are used to compare the empirical distribution function of a sample with that of a sample distributed according to a normal distribution of the same mean and variance. If the sample follows a normal distribution, the points will lie along the first bisector of the plan.
- Q-Q Plots (normal distribution) Q-Q plots (for Quantile-Quantile) are used to compare the quantities of the sample with those of a sample distributed according to a normal distribution of the same mean and variance. If the sample follows a normal distribution, the points will lie along the first bisector of the plan.
This tool complements the "Distribution fitting" tool, which allows you to determine the value of the parameters of the normal distribution and to test the goodness of fit using a Chi-square or a Kolmogorov Smirnov test.


analyze your data with xlstat
Related features