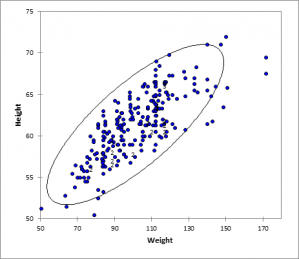
Scatter plots
Scatter plots are a simple way to visualize the association between two quantitative variables. Do it in Excel using the XLSTAT statistical software.

What is a scatter plot
A scatter plot or scattergraph is a type of diagram using Cartesian coordinates to display values for two or three variables for a set of data. The data is displayed as a collection of points, each having:
- The value of one variable determining the position on the horizontal axis,
- The value of the other variable determining the position on the vertical axis,
- The value of the third determining the size of the point.
- In addition a forth information can be added by using a qualitative variable to give the color to the points.
Use of scatter plots
A scatter plot can suggest various kinds of correlations between variables.
The Scatter Plots tool allows you to save a lot of time when avoiding manipulating the Excel graphics to reach a satisfactory result. It can take into consideration:
- the possible belonging of an observation to a group,
- the possible superimposition of some points on the graphic,
- the possible presence of observation labels,
- the need to cross several X variables (abscissa) and Y variables Y (ordinates).


analyze your data with xlstat
14-day free trial