Kruskal-Wallis test
The Kruskal Wallis test is a non parametric equivalent to ANOVA. Run the Kruskal Wallis test in Excel using the XLSTAT add-on statistical software.

What is the Kruskal-Wallis test
The Kruskal-Wallis test is often used as an nonparametric alternative to the one-way analysis of variance (ANOVA) where the assumptions are not met (like the assumption of normality). Nonparametric tests do not rely on any distribution. They can thus be applied even if parametric conditions of validity are not met. These tests are more robust than parametric tests. In other words, they are valid in a broader range of situations (fewer conditions of validity).
The Kruskal-Wallis nonparametric test is used to test if k samples (k>2) come from the same population or populations with identical properties as regards a position parameter (the position parameter is conceptually close to the median, but the Kruskal-Wallis test takes into account more information than just the position given by the median). This nonparametric test generalizes the Wilcoxon-Mann-Whitney test, which is used to compare only two groups.
This nonparametric is to be used when you have k independent samples, in order to determine if the samples come from a single population or if at least one sample comes from a different population than the others.
Definition of the Kruskal-Wallis test
If Mi is the position parameter for sample i, the null H0 and alternative Ha hypotheses for the Kruskal-Wallis test are as follows:
- H0: M1 = M2 = … = Mk
- Ha: There is at least one pair (i, j) such that Mi ≠ Mj
The calculation of the K statistic from the Kruskal-Wallis test involves, as for the Mann-Whitney test, the rank of the observations once the k samples (or groups) have been mixed. K is defined by:
K = 12/(N(N+1)) Σi=1..k [Ri²-3(N+1)]
where ni is the size of sample i, N is the sum of the ni's, and Ri is the sum of the ranks for sample i. When k=2, the Kruskal-Wallis test is equivalent to the Mann-Whitney test and K is equivalent to Ws. When there are ties, the mean ranks are used for the corresponding observations as in the case of the Mann-Whitney test.
Calculation of the p-value for the Kruskal-Wallis test
For the calculation of the p-value associated with a given value of K, XLSTAT offers three options:
- Asymptotic: The p-value is computed using the approximation of the distribution of K by a chi-square distribution with (k-1) degree of freedom. This approximation is good, except when N is small.
- Exact: The computation of the p-value is based on the true distribution of K. These computations be very intensive. It is recommended to use them on small samples only (N lower than 20).
- Monte Carlo: The computation is based on the random resampling of the N values. The user must choose the number of simulations (or resampling) to do. A 99% confidence interval around the p-value is provided. This interval will of course be smaller when the number of simulations increases.
When the p-value is such that the H0 hypothesis has to be rejected, then at least one sample (or group) is different from another. To identify which samples are responsible for rejecting H0, multiple comparison procedures can be used.
Multiple comparison method for the Kruskal-Wallis test
For the Kruskal-Wallis test, three multiple comparison methods are available:
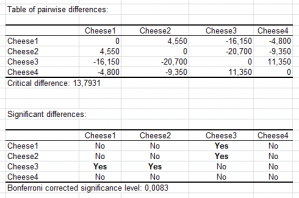
- Dunn (1963) The method is based on the comparison of the mean of the ranks of each treatment, the ranks being those used for the computation of K. The normal distribution is used as the asymptotic distribution of the standardized difference of the mean of the ranks.
- Conover et Iman (1999) Close to Dunn's method, this method uses a Student distribution. It corresponds to a t test performed on the ranks.
- Steel-Dwass-Critchlow-Fligner (1984) This more complex method is recommended by Hollander (1999). It requires the recalculation of the ranks for each combination of treatments. The Wij statistic is calculated for each combination. XLSTAT then calculates the corresponding p-value using the asymptotic distribution.
For the Dunn and the Conover-Iman methods, to take into account the fact that there are k(k-1)/2 possible comparisons, the correction of the significance level proposed by Bonferroni can be applied.
A tutorial showing how to use the Kruskal-Wallis test is available on the Addinsoft website.


analyze your data with xlstat
Related features