Mandel’s h and k statistics for outliers
Mandel's h and k statistics allow checking if results obtained by different laboratories are homogeneous. They are available in Excel with XLSTAT.

What are Mandel's h and k statistics?
The Mandel’s h and k statistics (1985, 1991) have been developed to help to identify outliers during inter-laboratories studies. The idea of these statistics is to detect differences between samples obtained from different laboratories to see if a sample contains outliers in comparison to others. The h statistic detects difference between means and the k statistic detects difference between variances.
How to calculate the h statistic?
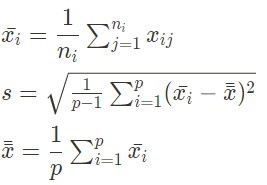
The h statistic is calculated with the following formula for sample i:
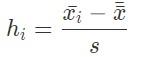
with x_i the mean in sample i, s the intergroup variance and x the overall mean.
It follows a Student distribution with p-2 degrees of freedom, p being the number of groups. If it takes extreme values, then the group has a significantly different mean from the other groups, which could show the presence of outliers in it.
How to calculate the k statistic?
The k statistic is calculated with the following formula:
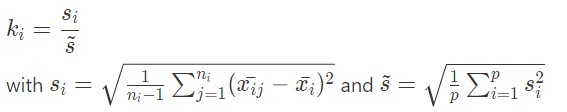
It follows a Fisher distribution. If it takes extreme values, then the group has a significantly different variance from the other groups, which could show the presence of outliers in it.
Detecting outliers
In statistics, an outlier is a value recorded for a given variable, that seems unusual and suspiciously lower or greater than the other observed values. One can distinguish two types of outliers:
- An outlier can simply be related to a reading error (on a measuring instrument), a keyboarding error, or a special event that disrupted the observed phenomenon to the point of making it incomparable to others. In such cases, you must either correct the outlier, if possible, or otherwise remove the observation to avoid that it disturbs the analyses that are planned (descriptive analysis, modeling, predicting).
- An outlier can also be due to an atypical event, but nevertheless known or interesting to study. For example, if we study the presence of certain bacteria in river water, you can have samples without bacteria, and other with aggregates with many bacteria. These data are of course important to keep. The models used should reflect that potential dispersion.
When there are outliers in the data, depending on the stage of the study, we must identify them, possibly with the aid of tests, flag them in the reports (in tables or on graphical representations), delete or use methods able to treat them as such.
To identify outliers, there are different approaches. For example, in classical linear regression, we can use the value of Cook’s d values, or submit the standardized residuals to a Grubbs test to see if one or two values are abnormal. The classical Grubbs test can help identifying one outlier, while the double Grubbs test allows identifying two. It is not recommended to use these methods repeatedly on the same sample. However, it may be appropriate if you really suspect that there are more than two outliers.
If the sample can be divided into sub-samples, we can look for changes from a sub-sample to another. The Cochran’s C test and the Mandel’s h and k statistics are part of the methods suitable for such studies.
References
Barnett V. and Lewis T. (1980). Outliers in Statistical Data. John Wiley and Sons, Chichester, New York, Brisbane, Toronto.
Hawkins D.M. (1980). Identification of Outliers. Chapman and Hall, London.
International Organization for Standardization (1994). ISO 5725-2: Accuracy (trueness and precision) of measurement methods and results—Part 2: Basic method for the determination of repeatability and reproducibility of a standard measurement method, Geneva.
Mandel J. (1991). The validation of measurement through interlaboratory studies. Chemometrics and Intelligent Laboratory Systems; 11, 109-119.
Mandel J. (1985). A new analysis of interlaboratory test results. In: ASQC Quality Congress Transaction, Baltimore, 360-366.
Wilrich P.-T. (2013). Critical values of Mandel’s h and k, the Grubbs and the Cochran test statistic. Advances in Statistical Analysis, 97(1), 1-10.

