PROCESS : MODERATION AND MEDIATION
Test your moderation and mediation hypothesis in Excel using the XLSTAT add-on statistical software.

PROCESS is a method that is complementary to the PLS-SEM approach and is very popular in the field of marketing as well as in the social and behavioral sciences. PROCESS is decomposed around two main concepts: mediation and moderation.
Mediation analysis is used to test hypotheses clarifying the various intermediate mechanisms by which causal effects arise, while moderation analysis is used to explore questions about the conditions of an effect.
What these two concepts have in common is that they explore the role played by a third variable in the relationship between an explanatory variable X and a response variable Y.
MEDIATION MODEL
The mediation model assumes that X influences a mediator M which, in turn, influences Y. The direct and indirect effects make it possible to conclude on the significance or not of the mediation model.
MODERATION MODEL
The moderation model assumes that X influences Y more or less strongly depending on a moderator W. The significance of the moderation is based on the significance or not of the coefficient associated with the interaction variable.
RESULTS OF A PROCESS ANALYSIS IN XLSTAT
The analysis of variance table is used to evaluate the explanatory power of the explanatory variables. The explanatory power is evaluated by comparing the fit (as regards least squares) of the final model with the fit of the rudimentary model including only a constant equal to the mean of the dependent variable.
The parameters of the model table displays the estimate of the parameters, the corresponding standard error, the Student’s t, the corresponding probability, as well as the confidence interval.
The direct effect of X on Y table displays the estimate of the direct effect of X on Y, the corresponding standard error, the Student’s t, the corresponding probability, as well as the confidence interval.
The conditional direct effect of X on Y table displays the estimate of the conditional direct effect of X on Y for three values of the moderator (the 16th percentile, the median, and the 84th percentile), the corresponding standard error, the Student’s t, the corresponding probability, as well as the confidence interval.
The indirect effect of X on Y table displays the estimate of the indirect effect of X on Y, and the corresponding confidence interval and standard deviation obtained by the bootstrap method. If the confidence interval includes 0, then the indirect effect of X on Y in the model is not significant.
The conditional indirect effect of X on Y table displays the estimate of the conditional indirect effect of X on Y for three values of the moderator (the 16th percentile, the median, and the 84th percentile), the corresponding standard error, the Student’s t, the corresponding probability, as well as the confidence interval. If the confidence interval includes 0, then for the moderator value in question, the conditional indirect effect of X on Y in the model is not significant.
The index of moderated mediation table displays the estimate of the index of moderated mediation, and the corresponding confidence interval and standard deviation obtained by the bootstrap method. If the confidence interval includes 0, the moderated mediation model is not considered significant.
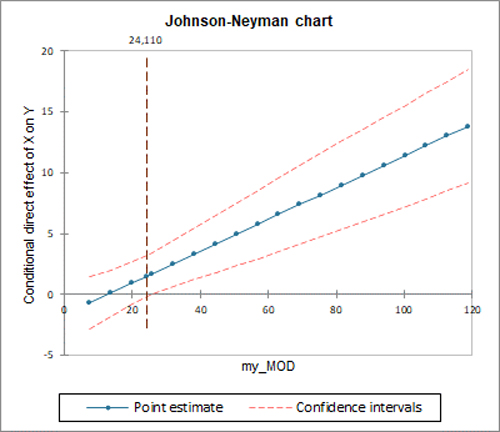
Johnson-Neyman chart: This chart is used to visualize at which value of the moderator the effect becomes significant.
Conditional effect chart: This chart is used to visualize the evolution of the conditional effect in the model for three values of the moderator (the 16th percentile, the median, and the 84th percentile).
Note: There are a lot of available predefined models. When you choose a model, the model is displayed directly on the right on the the dialog box.


analyze your data with xlstat
Included in