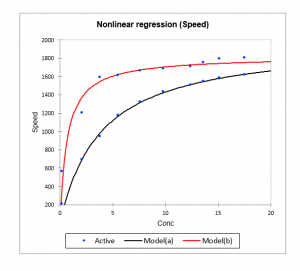
Nonlinear regression
Use this tool to fit data to any linear or non-linear function. Available in Excel using the XLSTAT add-on statistical software.

When to use nonlinear regression
Nonlinear regression is used to model complex phenomena which cannot be handled by the linear model. XLSTAT provides preprogrammed functions from which the user may be able to select the model which describes the phenomenon to be modeled. The user is also free to write other nonlinear functions.
Options for nonlinear regression in XLSTAT
Adding a function to the library of user-defined functions
When the model required is not available, the user can define a new model and add it to their personal library. To improve the speed and reliability of the calculations, it is recommended to add derivatives of the function for each of the parameters of the model.
When this is possible (preprogrammed functions or user-defined functions where the first derivatives have been entered by the user) the Levenberg-Marquardt algorithm is used. When the derivatives are not available, a more complex and slower but efficient algorithm is used. This algorithm does not, however, enable the standard deviations of the parameter estimators to be obtained.
Syntax:
- The parameters of the function must be written as pr1, pr2, etc.
- The explanatory variables must be represented as X1, X2, etc..
- Excel functions can be used: Exp(), Sin(), Pi(), Max(), etc.
- Example of a function: pr1 * Exp(pr2 + pr3 * X1 + pr4 * X2)
Model selection
There are three available options in the Function tab of the XLSTAT nonlinear regression feature:
- Choose a model: Fit a single function to the data and display its results.
- Choose a model among several: Fit several functions to the data and display the results of the best model, based on the AIC.
- Choose several models: Fit several functions to the data and display their results.
Global fitting and shared parameters
In XLSTAT, you have the possibility to adjust multiple variables at the same time. There are two ways to do this:
- The first one is to have one column for each dependent variable Y.
- The second one is to have one column containing all the Y variables to be adjusted and another column which contains the group indices making it possible to identify each Y. With this option, there you can choose a set of shared parameters that apply to a set of curves.
Results for nonlinear regression in XLSTAT
Correlation matrix: This table displays the correlations between the selected variables.
Goodness of fit coefficients: This table shows the following statistics:
- The number of observations;
- The degrees of freedom (DF);
- The determination coefficient R2;
- The sum of squares of the errors (or residuals) of the model (SSE or SSR respectively);
- The means of the squares of the errors (or residuals) of the model (MSE or MSR);
- The root mean squares of the errors (or residuals) of the model (RMSE or RMSR);
Model parameters: This table gives the value of each parameter after fitting to the model. For built-in functions, or user-defined functions when derivatives for the parameters have been entered, the standard deviations of the estimators are calculated.
Predictions and residuals: This table gives for each observation the input data, the value predicted by the model and the residuals. It is followed by the equation of the model.
Charts for nonlinear regression in XLSTAT
If only one quantitative explanatory variable has been selected, the first chart represents the data and the curve for the chosen function. The second chart is the bar chart of the residuals.


analyze your data with xlstat
Related features