JAR multivariate analysis and clustering
Use this tool to perform multivariate analysis (CATATIS) or clustering (CLUSCATA) on JAR (Just About Right) data.
WHAT IS JAR MULTIVARIATE ANALYSIS AND CLUSTERING?
JAR data is often only processed with penalty analysis, but they are packed with other information. In fact, just like the other tests, they can be used to describe products, to see similarities and differences, and so on. Performing a multivariate analysis and, at the same time, creating a map of products with their descriptions is very instructive. Moreover, clusters of assessors can be set up.
JAR MULTIVARIATE ANALYSIS AND CLUSTERING OUTPUTS IN XLSTAT
Eigenvalues of CA: The eigenvalues of CA and corresponding chart (scree plot) are displayed.
Product and attributes coordinates: The coordinates of the products and attributes of the consensus in the factors space are displayed with the corresponding charts.
Similarity matrix (S): The matrix of similarity index between all assessors is displayed. The similarity coefficient used is the Salton cosine which is included between 0 and 1. The closer it is to 1, the stronger the similarity. This matrix is used by CATATIS to calculate the weights of the assessors.
Weights: The weights calculated by CATATIS are displayed with the associated bar chart. The greater the weight, the more the assessor contributed to the consensus. Knowing that CATATIS gives more weight to the closest assessor from a global point of view, a much lower weight than the others will mean that the assessor is atypical.
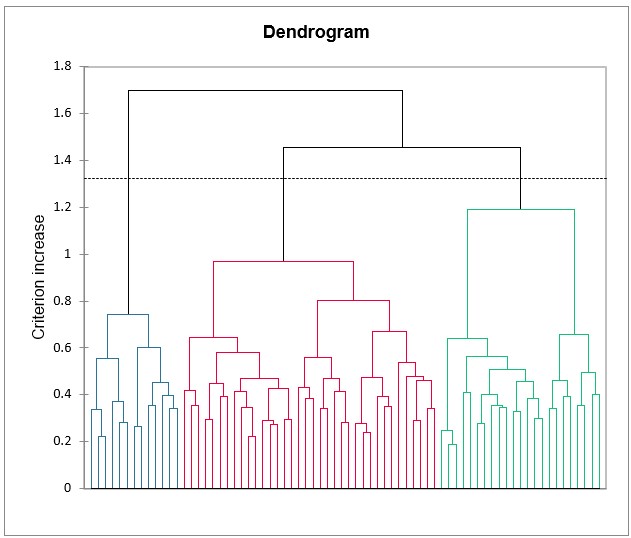
**CLUSCATA results**: If a cluster analysis is required, the dendrogram and the CATATIS results of each cluster are displayed.


analyze your data with xlstat
Included in
Related features