Parametric Illness-Death Model
Use this method to analyze survival-time data and model the movement of individuals among 3 states. Available in Excel using the XLSTAT software.

Description of Parametric Illness-Death Model in XLSTAT
Multi-state models are used when we observe more than 2 states. The illness-death models are a special case of multistate models with 3 states: the initial state, the transient state and the absorbing state — also called state 0, state 1 and state 2.
This model is frequently used in medical applications and research to analyze disease evolution or mortality. There are also many applications in the actuarial field to calculate the cost of insurance and viatical contracts.
Censoring and truncation
In survival analysis, truncation and censoring are phenomena that cause our samples to be incomplete. If we ignore them when analyzing our data, our estimates of population parameters will be inconsistent. The Illness-Death model in XLSTAT allows right censoring, interval censoring and left truncation, assuming that the censoring and truncation are non-informative.
Censoring occurs when we do not know the exact time of an event, while truncation occurs when we do not observe individuals with event times that are smaller or larger than certain values.
Right censoring: the individual does not go to the absorbing state at the end of the observation. Given t the event time and tend the end time observation, hence t > tend
Interval censoring: the event happened between two observations. Given tt the event time and tl and tl+1 two consecutive time observations, hence t ∈ [tl , tl+1]
Left truncation: the event does not happen below a threshold. In our cases, the event cannot occur before the start of the study.
Levenberg-Marquardt Algorithm (LMA)
The Levenberg-Marquardt Algorithm (LMA) estimates transition intensities and regression parameters by maximizing the log-likelihood.
The LMA is a combination of two other methods:
The Deepest Gradient: maximizes the log-likelihood and updates the parameters at each iteration folowing the gradient direction.
Newton-Raphson: maximizes the log-likelihood derivates and updated parameters at each iteration.
LMA alternates these two methods throughout the optimization. LMA acts like the Deepest Gradient method when the parameters are far from the solution; it acts like the Newton-Raphson method when the parameters are close to the solution. This makes the LMA faster than the gradient method (which suffers from various convergence problems) and more robust than the Newton method (which has a high computational cost).
Remark: Despite the efficiency and robustness of the LMA, the Illness-Death model is a complex model and convergence is not guaranteed. Convergence failure may come from an insufficient number of observations, or from the data, for example, if one state is not reprensented in the dataset.
Predictions: transition probabilities and life expectancy
Predictions give transition probabilities and life expectancies between 2 times:
- entry time in the study
- end time in the study
7 transition probabilities are calculated :
- p00 the probability of remaining in the initial state
- p01 the probability of going from the initial state to the transient state
- p02 the probability of going from the initial state to the absorbing state
- p11 the probability of remaining in the transient state
- p12 the probability of going from the transient state to the absorbing state.
3 life expectancies are calculated:
E00 the life expectancy in state 0 (healthy life expectancy): time expected for an individual to remain in the initial state given that he is in the initial state
E02 the life expectancy: time expected for an individual to stay alive (does not go in the absorbing state) given that he is in the initial state
E12 the disease life expectancy: time expected for an individual to stay alive (does not go in the absorbing state) given that he is in the transient state.
The formulas of these probabilities and life expectancies are given in Touraine C. (2013).
Results of Parametric Illness-Death Model in XLSTAT
XLSTAT offers a large number of tables and graphs to facilitate the analysis and interpretation of the results.
Descriptive statistics: A descriptive statistics table shows simple statistics for status indicator and time data. For time data, the number of observations, the amount of missing data, the amount of non-missing data, the mean and the standard deviation (unbiased) are displayed. For status indicator, the modalities, their numbers and their percentages are displayed.
Weibull parameters and Regression coefficients: these tables show the Weibull parameters and regression coefficients. Weibull parameters are used to calculate the baseline intensities. If covariates are included in the model, a regression coefficients table gives the coefficients estimation, the standard deviation, the χ2-Wald and the p-value associated for each variable. And a Hazard Rate (exponential of the coefficients) is given with the associated confidence interval.
Transition intensities: this table shows the transition intensities, which is the analog of the risk function in survival analysis. The transition intensities help to compare the risk of transition between states.
Transition probabilities: this table shows the transition probabilities. These quantities help to compare the transition between states. More intuitive than the transition intensities, the transition probabilities help the user interpretation.
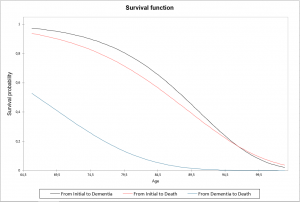
Survival distribution: this table shows the survival distributions. These quantities help to compare the transition between states. More intuitive than the transition intensities, survival distributions help the user interpretation.
Predictions: this table shows the predicted transition probabilities and the 3 life expectancies: in the common sense, of staying sick (remaining in the transient state) and staying healthy (remaining in the initial state). The predictions are computed between 2 times indicated by the user: entry and end time of the study. If covariates have been added to the predictions, predictions are made for each individual with the covariates associated, otherwise the results correspond to a single individual.
Example of Parametric Illness-Death Model in XLSTAT
An example of the application of the parametric disease-death model is available on our helpcenter.


analysieren sie ihre daten mit xlstat
Enthalten ind
Verwandte Funktionen