Multiple Factor Analysis (MFA)
Multiple Factor Analysis (MFA) investigates the relationships between several sets of variables. Run MFA in Excel using the XLSTAT statistical software.

Multiple Factor Analysis (MFA) makes it possible to analyze several tables of variables simultaneously, and to obtain results, in particular, charts, that allow studying the relationship between the observations, the variables, and tables (Escofier and Pagès, 1984). Within a table, the variables must be of the same type (quantitative table, qualitative table or frequency table), but the tables can be of different types.
This method can be very useful to analyze surveys for which one can identify several groups of variables, or for which the same questions are asked at several time intervals.
Principles of Multiple Factor Analysis
The MFA is a synthesis of the PCA (Principal Component Analysis) for quantitative tables, the MCA (Multiple Correspondence Analysis) for qualitative tables and the CA (Correspondence Analysis) for frequency tables. The methodology of the MFA breaks up into two phases:
1. We successively carry out for each table a PCA, an MCA or a CA according to the type of the variables of the table. One stores the value of the first eigenvalue of each analysis to then weight the various tables in the second part of the analysis.
2. One carries out a weighted PCA on the columns of all the tables, knowing that the tables of qualitative variables are transformed into complete disjunctive tables, each indicator variable having a weight that is a function of the frequency of the corresponding category. The weighting of the tables prevents that the tables which include more variables weight too much in the analysis.
The originality of method is that it allows visualizing in a two or three-dimensional space, the tables (each table being represented by a point), the variables, the principal axes of the analyses of the first phase, and the individuals. In addition, one can study the impact of the other tables on an observation by simultaneously visualizing the observation described by all the variables and the projected observations described by the variables of only one table.
MFA options in XLSTAT
Data type: Specify the type of data contained in the various tables, knowing that the type must be the same within a given table. In the case where the "Mixed type" is selected, you need to select a column that indicates the type of data in each table. Use 0 for a table that contains quantitative variables, 1 for a table that contains qualitative variables and 2 for frequency tables.
Filter factors: You can activate one of the following two options in order to reduce the number of factors for which results are displayed.
Minimum %: Activate this option then enter the minimum percentage of the total variability that the chosen factors must represent.
Maximum Number: Activate this option to set the number of factors to take into account.
PCA options: (only for quantitative tables)
- PCA type: you can choose between correlation (normalized PCA) or covariance (non-normalized PCA).
MCA options: (only for qualitative tables)
Sort categories alphabetically: Activate this option so that the categories of all the variables are sorted alphabetically.
Variable-Category labels: Activate this option to use variable-category labels when displaying outputs. Variable-Category labels include the variable name as a prefix and the category name as a suffix.
Results for Multiple Factor Analysis
Descriptive statistics: The table of descriptive statistics shows the simple statistics for all the variables selected. This includes the number of observations, the number of missing values, the number of non-missing values, the mean and the standard deviation (unbiased).
The results of the analyses performed on each individual table (PCA, MCA or CA) are then displayed if you have selected the option Display results for separate analyses. These results are identical to those you would obtain after running the PCA, MCA or CA function of XLSTAT.
Afterwards, the results of the second phase of the MFA are displayed.
At first, eigenvalues, variable results and observation results are displayed as in the case of PCA. Then the results specific to MFA are displayed:
The coordinates of the tables are then displayed and used to create the plots of the tables. The latter allow to visualize the distance between the tables. The coordinates of the supplementary tables are displayed in the second part of the table. Then contributions and squared cosines for tables are displayed.
Lg coefficients: The Lg coefficients of relationship between the tables allow to measure to what extent the tables are related two by two. The more variables of a first table are related to the variables of the second table, the higher the Lg coefficient.
RV coefficients: The RV coefficients of relationship between the tables are another measure derived from the Lg coefficients. The value of the RV coefficients varies between 0 and 1.
The coordinates of the partial axes, and even more their correlations, allow to visualize in the new space the link between the factors obtained from the first phase of the MFA, and those obtained from the second phase.
The correlations between partial axes allow to understand the link between factorial axes of the different analyses.
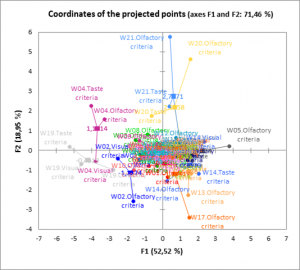
Last, the coordinates of the projected points in the space resulting from the MFA are displayed. The projected points correspond to projections of the observations in the spaces reduced to the dimensions of each table. The representation of the projected points superimposed with those of the complete observations makes it possible to visualize at the same time the diversity of the information brought by the various tables for a given observation, and to visualize the relative distances from two observations according to the various tables.


analyze your data with xlstat
Related features