XLSTAT version 2021.3.1

XLSTAT 2021.3.1 is now available! What’s new?
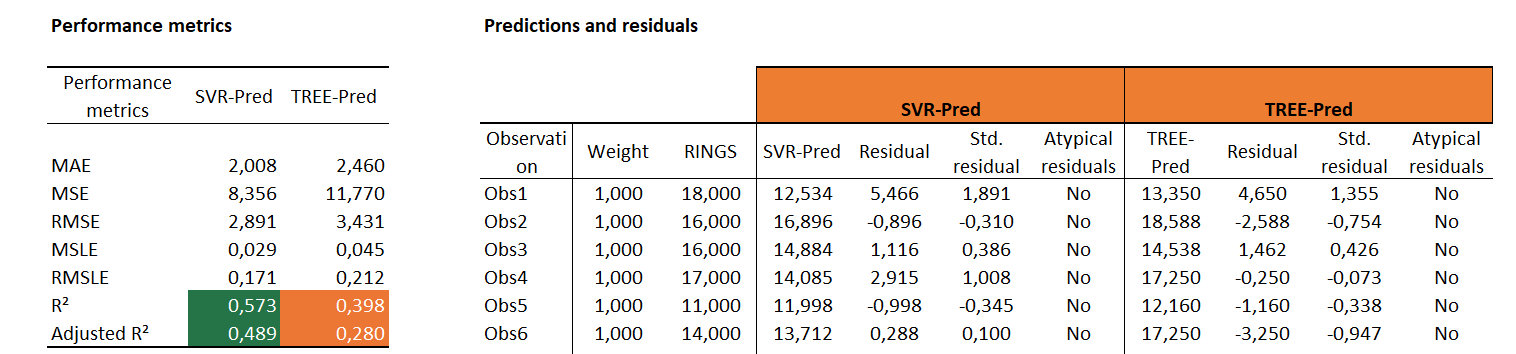
Model Performance Indicators (available in all XLSTAT solutions except Basic)
The Performance Indicators tool was developed to help you answer the following question : How much can I trust a model to predict future events? XLSTAT provides you with a large number of indicators to evaluate the performance of a model depending on the type of variable of interest (quantitative or qualitative).
For regression problems (when trying to predict the values of a quantitative variable), XLSTAT proposes indicators such as MSE, MAPE, R², Mielke and Berry index, AIC and many others.
For classification problems (when the variable we need to predict is qualitative), XLSTAT proposes indicators such as Accuracy, Precision, Sensitivity, Specificity, Cohen Kappa, ROC curve and many others.
Access this new feature under the Machine Learning menu!
Designs for Choice-Based Analysis (available in XLSTAT Marketing & Premium)
This essential tool for market research analysis has been improved! You can now create quicker and more reliable CBC questionnaires. What’s new:
You can now choose the type of design in the Options tab without opening in a separate window. If you want an experiment design that fits your data exactly, select the D-Optimal Plan option. If you wish to get an orthogonal design, select the option Orthogonal Plan. Do you want to know more about these methods? Check out the XLSTAT Help documentation.

Two new tables have been added to the output of the conjoint analysis plans: the Burt table and the Encoded design in the case of a d-optimal design.
The Fedorov algorithm has been revised so that you can create better balanced and thus more efficient designs. A balanced design contains an equal number of observations for all possible level combinations. For example, a survey for cars would be balanced if we collect the same amount of data for brand A and for brand B.
Access this new feature under the Conjoint Analysis menu.
Binary Classification Trees (available in all XLSTAT solutions except Basic)
Binary classification trees deal with assigning an individual to one of two categories. For example, predict whether or not a patient has diabetes. After building your binary classifier, it is important to know how well it performs. For this reason, we have added three new evaluation metrics: the ROC curve, the Lift curve, and the Cumulative gain curve.
Access this new feature under the Machine Learning menu.
How to get XLSTAT 2021.3.1?
Version 2021.3.1 will give you access to all the above improvements, advanced options and increase the performance of your software. Installing our new version is recommended for all users.
If you are currently using our trial version or have a valid license, you can download version 2021.3.1 for free at:
If you have a perpetual license without access to free upgrades and maintenance, please or contact us for further information.
Letzte Tweets
Kein Tweet