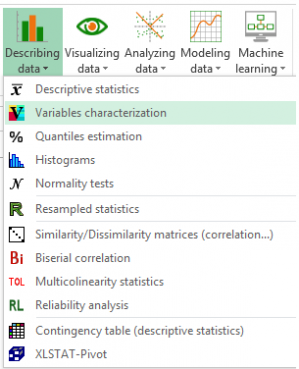
Charakterisierung der Variablen
Variable characterization will let you easily describe quantitative or qualitative variables. It is available in Excel using the XLSTAT statistical software.

What is variable characterization?
Variable characterization allows to characterize elements (quantitative variables, qualitative ones or categories of qualitative variables) exploring the links they share with characterizing variables (quantitative variables, qualitative variables or categories of qualitative variables).
Here are the various characterizing possibilities of the procedure:
1) Characterization of a quantitative variable:
i) With other quantitative variables:
Characterization of a quantitative variable by other quantitative variables is carried out using the correlation coefficient. For each characterizing quantitative variable, a test is performed to determine whether the latter is significantly different from 0. The Pearson correlation test is implemented in a parametric context while the Spearman correlation test is preferred in a non-parametric one. The more significantly different from 0 the correlation coefficient, the stronger the link between the 2 quantitative variables.
ii) With qualitative variables:
Characterization of a quantitative variable by qualitative variables is carried out using the correlation ratio. For each qualitative variable (with k categories), a test is performed to determine whether the latter is significantly different from 0. In a parametric framework, the Student t-test (k=2) (resp. Fisher F-test (k>2)) is implemented while the Wilcoxon (k=2) (resp. Kruskal-Wallis (k>2)) test is preferred in a non-parametric one. The more the correlation ratio significantly different from zero, the stronger the link between the quantitative variable to characterize and the characterizing qualitative variable.
iii) With categories:
Characterization of a quantitative variable by categories is carried out using a mean comparison test. For each category, it consists in determining whether the mean of the quantitative variable to characterize in the group whose members share this category is significantly different from the mean of the quantitative variable to characterize considering the whole sample.
2) Characterization of a qualitative variable (with k categories):
i) With quantitative variables:
Characterization of a qualitative variable by quantitative variables is carried out using the correlation ratio. For each quantitative variable, a test is performed to determine whether it is significantly different from 0. In a parametric framework, the Student t-test (k=2) (respectively Fisher F-test (k>2)) is implemented while the Wilcoxon (k=2) (respectively Kruskal-Wallis (k>2)) test is preferred in a non-parametric one. The more the correlation ratio significantly different from zero, the stronger the link between the quantitative variable to characterize and the characterizing qualitative variable.
ii) With other qualitative variables:
Characterization of a qualitative variable by other qualitative variables is carried out using a test for independence. For each characterizing qualitative variable, a test is performed to determine whether it is statistically independent from the qualitative variable to characterize. In a parametric framework, the Chi-square test for independence is used while the Fisher’s exact test is preferred in a non-parametric one.
3) Characterization of a category:
i) With quantitative variables:
Characterization of a category by quantitative variables is carried out using a mean comparison test. For each characterizing quantitative variable, a test is implemented to determine whether the mean of that quantitative variable in the group whose members share the category is significantly different from its mean in the whole sample.
ii) With other categories:
Characterization of a category by other categories is carried out using a proportion comparison test. For each characterizing category, a test is performed to determine if the proportion of individuals sharing both category to characterize and characterizing category is significantly different from the theoretical expected proportion. If the observed proportion is greater than the theoretical one, the category is over-represented in the group whose members share the category to characterize. Conversely, if it is smaller, the category is under-represented.


analysieren sie ihre daten mit xlstat
Verwandte Funktionen