RATA data analysis
Use RATA data analysis to analyze Rate-All-That-Apply (RATA) data.
This method allows:
Study and visualize the links between the products and attributes.
Study the agreements between the assessors.
Perform a cluster analysis of the assessors
WHAT IS RATA DATA ANALYSIS?
RATA data analysis is a method used in sensory evaluation to collect and analyze data on consumer perceptions of products.
RATA is useful for assessing sensory characteristics of products, informing product development, and quality control in industries such as food and beverage, cosmetics, and consumer goods.
Participants rate product attributes such as taste, texture, or appearance using a numerical scale or rating system. Ratings are analyzed to identify patterns and trends using multivariate statistical analysis.
RATA DATA ANALYSIS OUTPUTS IN XLSTAT
Assessors' repeatability: The coefficient of similarity (Salton Cosine) between the results of different sessions is displayed. This coefficient takes values between 0 and 1 and increases with the similarity between sessions.
Eigenvalues: The eigenvalues of CA or PCA and corresponding chart (scree plot) are displayed.
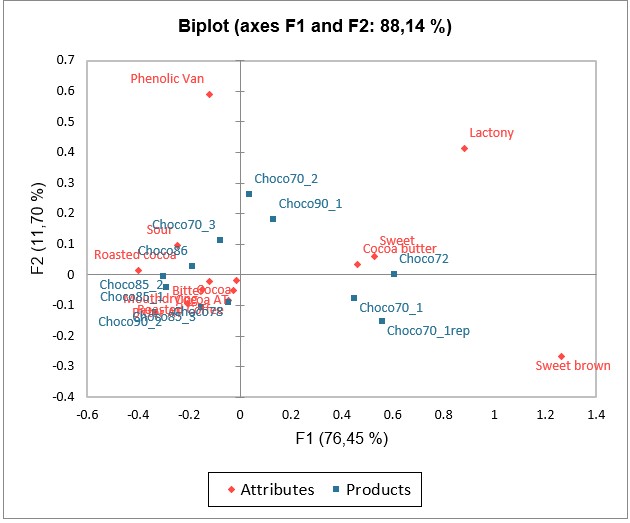
Product and attributes coordinates: The coordinates of the products and attributes of the consensus in the factors space are displayed with the corresponding charts.
Similarity matrix (S): The matrix of similarity index between all assessors is displayed. The similarity coefficient used is the Salton cosine which is included between 0 and 1. The closer it is to 1, the stronger the similarity. This matrix is used by CATATIS to calculate the weights of the assessors.
Weights: The weights calculated by CATATIS are displayed with the associated bar chart. The greater the weight, the more the assessor contributed to the consensus. Knowing that CATATIS gives more weight to the closest assessor from a global point of view, a much lower weight than the others will mean that the assessor is atypical.
Thanks to our internal research, you can also apply an adaptation of the CLUSCATA method for RATA data. Therefore, you can make a clustering of assessors based on the characterizations of the products.


analyze your data with xlstat
Related features