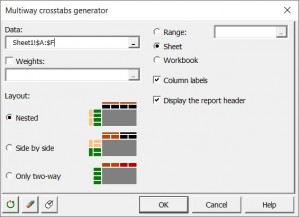
Multiway crosstabs generator
Use this tool to create crosstabs (or cross tables) from as many categorical variables as needed.

In comparison with the two-way cross-tab tool in XLSTAT, the multiway crosstabs generator allows you to create crosstabulations of multiple categorical variables. A cross table is built by crossing qualitative variables which are found in lines, and others in columns. The cells of a crosstab can simply include the number of occurrences of a given cross in the dataset, the corresponding percentage, or a statistic calculated on a quantitative variable.
Which types of crosstabs are available in XLSTAT?
XLSTAT allows you to generate three types of crosstabs:
- Categorical variables are nested inside each other (for both rows and columns)
- Categorical variables are displayed one after the other (side by side)
- You can generate all possible two-way crosstabs from the selected row and column variables (only two-way)
Which statistics are displayed in the XLSTAT multiway crosstabs?
By default, a crosstab makes it possible to calculate the number of cases corresponding to each cross. In XLSTAT, it is also possible to calculate the % associated with the counts in the same way (by dividing the counts by the total number and multiplying by 100). Moreover, if quantitative variables are available, it is possible to calculate statistics for these variables, and for each crossing. For example, in the case of a table that would cross on the one hand the age and the sex in rows, with the occupational category in a column, one can display in the cells of the cross table the average income for the individuals corresponding to every possible crossing.


analyze your data with xlstat
Related features