CATATIS
Use CATATIS to analyze Check-All-That-Apply (CATA) data when dealing with atypical assessors. Available in Excel with the XLSTAT software.

What is CATATIS method and when to use it?
The CATATIS method is an improvement of the usual method for processing CATA data. It is considered as the equivalent of the STATIS method for this type of data. The great interest of CATATIS lies in the fact that atypical assessors have a lower weight than those who agree with the rest of the panel. Therefore, the analysis best reflects the general point of view and not those atypical assessors.
There are several applications for CATATIS, including:
Study and visualization of the products and the attributes in the main plans;
Study of the links between the assessors, especially to find the most atypicals.
Principle of CATATIS
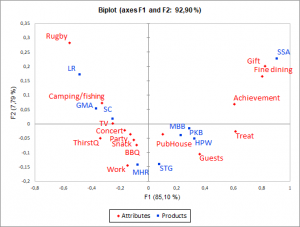
The objective of CATATIS is to form a consensus configuration that reflects at best the different assessors. This consensus can then be projected on different axes by a Correspondance Analysis. If the information associated with 2 or 3 first axes represents a sufficient percentage of the total variability of the consensus, the products and attributes will be able to be represented on a 2- 3-dimensional chart, thus making interpretation much easier.
Structure of the data for running a CATATIS analysis
There are two different formats:
All the data are merged horizontally (horizontal format).
All the data are merged vertically (vertical format).
For data entry, XLSTAT asks you to select all the data, and to give the format type. In the case of the vertical format, product and assessor labels are mandatory.
Interpreting the results of a CATATIS analysis
The representation of the products and attributes in the space of k factors allows to visually interpret the proximities between the products and attributes, by means of precautions.
We can consider that the projection of a product or an attribute on a plan is reliable if it is far from the center of the graph.
Number of factors in CATATIS
Two methods are commonly used to determine how many factors must be retained for the interpretation of the results:
Watch the decreasing curve of eigenvalues. The number of factors to be kept corresponds to the first turning point found on the curve.
We can also use the cumulative variability percentage represented by the factor axes and decide to use only a certain percentage.
Graphic representations in CATATIS
These representations are only reliable if the sum of the variability percentages associated with the axes of the representation space are sufficiently high. If this percentage is high (for example 80%), the representation can be considered as reliable. If the percentage is low, it is recommended to produce representations on several axis pairs in order to validate the interpretation made on the two first factor axes.


analyze your data with xlstat
Related features