XLSTAT Sensory - Make the right decisions before launching your products
Preference data analysis (new method)
What is it?
If you are working with preference data, i.e. scores that consumers have given to your products on a predefined scale, then this new analysis is perfect for you!
It will help you make the right decisions regarding the marketing of your products. You will be able to compare your products with each other and define groups of consumers depending on their preferences as well as identify the product preferred by each group.
Let’s have a sneak peek!
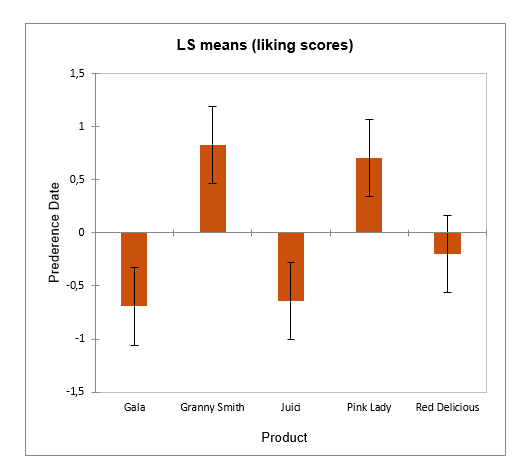
From a preference study on 5 apples, you can determine which apples are the most appreciated, compare the apples two by two and determine if the subjects have similar preferences regarding the apples.
For instance, this graph shows us the effect of each apple variety on the preference data: Red delicious makes the mean liking score increase, while Gala makes it go down. Overall, Red Delicious and Juid apples are more appreciated than Pink Lady and even more than Gala or Granny Smith ones.
Try it for yourself! Follow our tutorial.
Projective mapping data analysis (new method)
What is it?
Do you want to evaluate several products but you do not have time to train your assessors? Projective mapping data analysis is the perfect XLSTAT tool for you!
It will help you study the relationships between the products and analyze if assessors have similar preferences or if some of them are atypical.
You simply need to ask each assessor to place several products on a paper sheet depending on how similar they perceive them. The coordinates of the products are then retrieved from the sheet and analyzed using the STATIS method or Multiple Factor Analysis (MFA).
Let’s have a sneak peek!
Let's imagine that you need to compare different brands of smoothies.
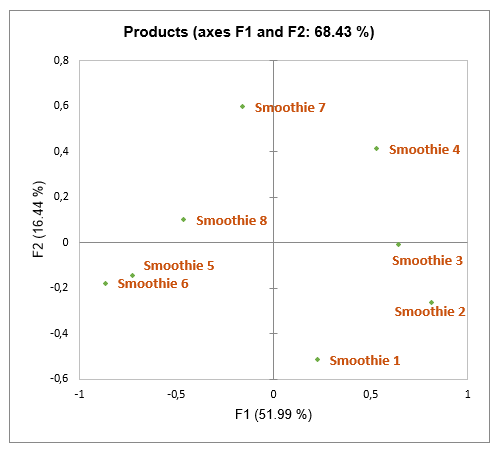
Among the XLSTAT outputs, you’ll get the product map.
For instance, the map below shows the similarities between the smoothies. Smoothie 5 and Smoothie 6 seem to have similar tastes according to the assessors, while Smoothie 1 and Smoothie 7 seem to be very different.
Try it for yourself! Follow our tutorial.
Sensory Discrimination Tests (improvement)
What is it?
If you want to detect sensory differences or similarities between your products, you can use one of the six XLSTAT discrimination tests.
Here are the six tests we propose:
- The triangle test
- The duo-trio test
- The two of five test
- The 2-AFC test
- The 3-AFC test
- The tetrad test
An example
Let's say you want to market a new white wine and find out if this new product is perceived as sweeter than another wine. You can then use a triangle test to evaluate the difference in taste and know if consumers can differentiate the two wines.
What’s new?
It is now possible to take into account several sessions for your discrimination tests. We have added the Beta-binomial model for data with sessions in the Data format field of the General tab.
Read more on each sensory test XLSTAT offers or follow our tutorial to generate your own discrimination test.
How to benefit from our latest improvements?
Don't miss this chance! Upgrade your XLSTAT now by installing the latest version.
Latest tweets
No tweet to display