Redundancy analysis (RDA)
Redundancy analysis (RDA) is a technique used to explain a dataset Y using a dataset X. Run RDA in Excel using the XLSTAT add-on statistical software.

What is Redundancy Analysis
Redundancy Analysis (RDA) was developed by Van den Wollenberg (1977) as an alternative to Canonical Correlation Analysis (CCorA).
Redundancy Analysis allows studying the relationship between two tables of variables Y and X. While the Canonical Correlation Analysis is a symmetric method, Redundancy Analysis is non-symmetric. In Canonical Correlation Analysis, the components extracted from both tables are such that their correlation is maximized. In Redundancy Analysis, the components extracted from X are such that they are as much as possible correlated with the variables of Y. Then, the components of Y are extracted so that they are as much as possible correlated with the components extracted from X.
Principles of Redundancy Analysis
Let Y be a table of response variables with n observations and p variables. This table can be analyzed using Principal Component Analysis (PCA) to obtain a simultaneous map of the observations and the variables in two or three dimensions.
Let X be a table that contains the measures recorded for the same n observations on q quantitative and/or qualitative variables.
Redundancy Analysis allows to obtain a simultaneous representation of the observations, the Y variables, and the X variables in two or three dimensions, that is optimal for a covariance criterion (Ter Braak 1986).
Redundancy Analysis can be divided into two parts:
- A constrained analysis in a space which number of dimensions is equal to min(n-1,p, q). This part is the one of main interest as it corresponds to the analysis of the relation between the two tables.
- An unconstrained part, which corresponds to the analysis of the residuals. The number of dimensions for the unconstrained RDA is equal to min(n-1, p).
It is also possible to use Partial Redundancy Analysis that adds a preliminary step. The X table is subdivided into two groups. The first group X(1) contains conditioning variables which effect we want to remove, as it is either known or without interest for the study. Regressions are run on the Y and X(2) tables and the residuals of the regressions are used for the Redundancy Analysis step. Partial Redundancy Analysis allows you to analyze the effect of the second group of variables, after the effect of the first group has been removed.
Biplot scaling in Redundancy Analysis
XLSTAT offers three different types of scaling. The type of scaling changes the way the scores of the response variables and the observations are computed, and as a matter of fact, their respective position on the plot.
Results for Redundancy Analysis in XLSTAT
If a permutation test was requested, its results are first displayed so that we can check if the relationship between the tables is significant or not.
Eigenvalues and percentages of inertia: In these tables are displayed for the constrained RDA and the unconstrained RDA the eigenvalues, the corresponding inertia, and the corresponding percentages, either in terms of constrained inertia (or unconstrained inertia), or in terms of total inertia.
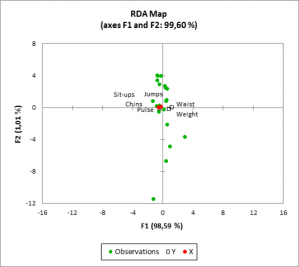
The scores of the observations, response variables and explanatory variables are displayed. These coordinates are used to produce a summary plot. The chart allows you to visualize the relationship between the sites, the objects and the variables. When qualitative variables have been included, the corresponding categories are displayed with a hollowed red circle.

