Price Elasticity of Demand
Use this tool to identify the price of your products at which the maximum revenue is generated. Available in Excel with the XLSTAT software.

What is Price Elasticity of Demand?
The analysis of price elasticity of demand (PED or Ed ) is essential in marketing because it is an approach that allows setting the price of a product, knowing that the goal, at least in the mid-term, is to maximize the revenue generated by the product.
The elasticity which concept is due to Alfred Marshall (1920) is defined as the relative variation of demand (or quantity sold) Q when price P changes. In general, an increase in prices is accompanied by a decrease in the quantities sold (although many examples to the contrary exist). Elasticity is therefore often a negative quantity, although some authors take the opposite.
As dQ/dP mathematically corresponds to an infinitesimal variation at a given point, in practice, we compute the point elasticity or the arc elasticity.
Point elasticity is defined as the ratio of the relative variation of the quantity sold when prices are changed from P1 à P2, and the relative variation of prices.
Arc elasticity is the ratio of, the relative variation of the quantity sold Q2Q2, when prices increase from P1 to P2, and the relative variation of prices.
XLSTAT allows to compute both types of elasticities.
It is common to represent the curves connecting quantity and price by putting the price in the ordinate and the quantity in the abscissa. This is counterintuitive in our case, since we are here in a perspective where the quantities sold depend on prices, and it can be explained by the underlying economic theory of the study of supply and demand and the study of market equilibria, where the price is determined according to available supply and demand. XLSTAT displays the graphics following both alternatives.
Price Elasticity of Demand in XLSTAT
The PED dialog box is divided into several tabs that correspond to a variety of options ranging from the selection of data to the display of results.
In the output, the summary statistics table displays descriptive statistics for prices and demand. The number of missing values, the number of non-missing values, the mean and the standard deviation (unbiased) are displayed.
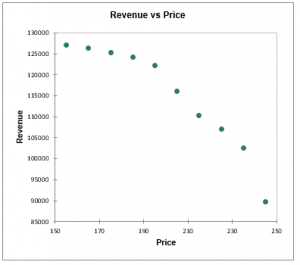
XLSTAT displays in a first table the price, the demand, the revenue and the point elasticity if it was requested. If the arc elasticity has been requested, a second table displays for each median point calculated the price, the demand, the revenue and the arc electricity.
These various elements are then crossed in a series of graphs.


analyze your data with xlstat
Related features