Factorial analysis of mixed data (PCAmix)
Use PCAmix method to analyze a data table where observations are described by quantitative variables and qualitative variables. Available in Excel with XLSTAT.

What is Factorial analysis of mixed data?
Factorial analysis of mixed data is a method initially developed by Hill and Smith (1972). A few variants of this method have been developed since then (Escofier 1979, Pagès 2004). The method used in Xlstat is called PCAmix and was developed by Chavent et al (2014). This method can be seen as a mixture of two popular methods of factorial analysis: Principal Component Analysis (PCA) which allows to study an observations/quantitative variables table and Multiple Correspondence Analysis (MCA) which allows to study an observations/qualitative variables table.
Similarly to other factorial analysis methods, PCAmix aims to reduce data dimensionality as well as to identify nearness between variables but also proximity between the observations.
To do so, it does a series of statistical transformations, including calculations of the correlation matrix, eigenvalues and eigenvectors, on a set of qualitative and/or quantitative variables in order to project them on a vector space generated by orthogonal components. The number of principal components is chosen depending on the explained percentage of variance of the model by each component. This is when the dimensional reduction occurs because a small number of components will be enough to explain a high percentage of the variance.
The observations and the variables end up being represented as points in orthogonal two-dimensional spaces. Sometimes, only the first and second components are necessary to explain a large percentage of the variance and so you will be able analyze a two-dimensional projection of what was initially dozens of variables.
Options for factorial analysis of mixed data in XLSTAT
Several options ranging from the selection of data to the display of results are available such as introducing observation weights, filtering factors based on inertia, adding supplementary observations/variables and customizing charts.
For example, you can choose the best number of components by setting a maximum number or by setting a minimum percentage of variance to be explained by each component.
If you have missing values in your dataset, ou can choose to not accept, remove or replace missing data. All missing quantitative values are replaced by the mean of the variable while a "missing" category will be created for qualitative variables.
You can choose to plot some summary statistics (minimum, maximum, mean, standard deviation) for quantitative variables, but also for the qualitative ones (counts and frequencies). Like in a regular PCA, you can also display the plot of eigenvalues.
Results for factorial analysis of mixed data in XLSTAT
The PCAmix method supplies the same classic results as other factorial analysis methods: factorial coordinates, contributions and squared cosines. These results are interpreted in the following way, same as in PCA or MCA.
What are the factorial coordinates of a PCAmix?
The factorial coordinates are the decomposition of each observation or variable on the principal components. They enable the points to be plotted and so we can have an interpretation of the angles between the variables, observations and axes.
What are the contributions of a PCAmix?
The contributions of variables to a principal component represent the level of accounting of the variable for the variance of said component. Contributions can be used to decide whether to keep or not a variable in the model because variables with very low or close to no contribution to the chosen components will not be useful for the statistical interpretation.
What are the squared cosines of a PCAmix?
The squared cosines of a PCAmix represent the correlation of the variables with each principal component (or axis). They are directly measured by squaring the cosines of the angles between the vectors which have the points as coordinates and the origin of the graph. The squared cosines take values between 0 and 1. For example, a squared cosine close to 1 means that the variable is has a high correlation with the principal component.
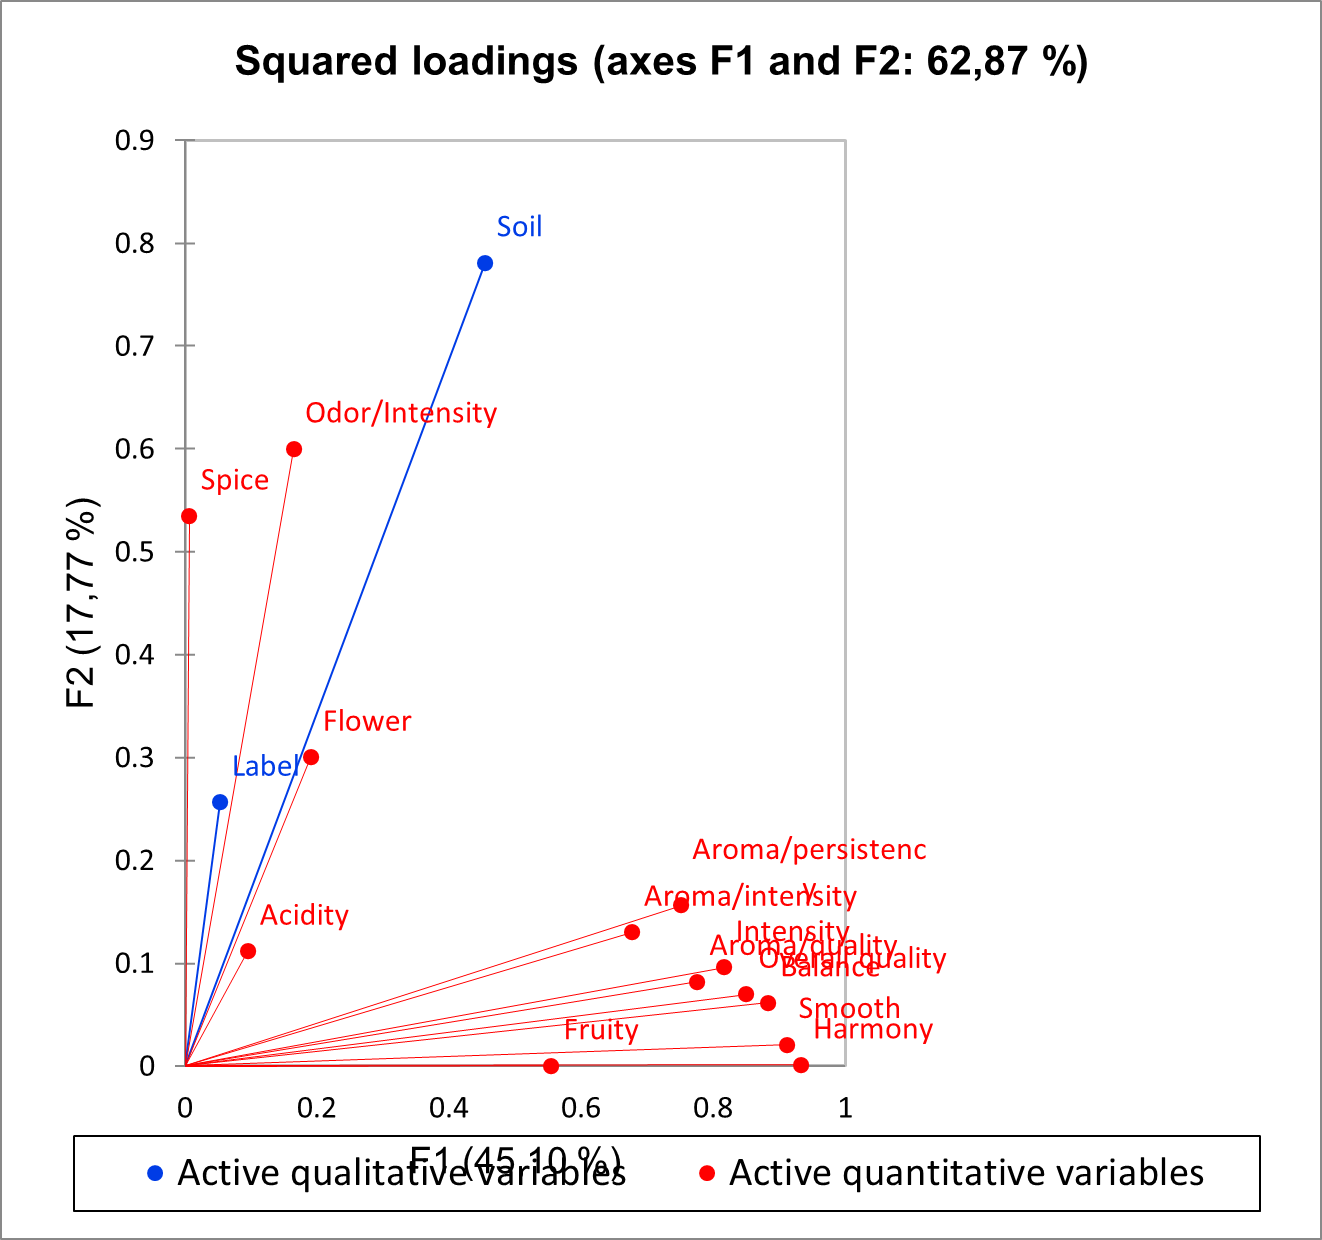
What are the squared loadings of a PCAmix?
A specific output of PCAmix is called squared loadings of variables. The squared loading between a quantitative variable and a factorial axis is equal to the squared correlation between the variable and the axis. The squared loading between a qualitative variable and a factorial axis is equal to the correlation ratio between the variable and the axis.
Charts for factorial analysis of mixed data in XLSTAT
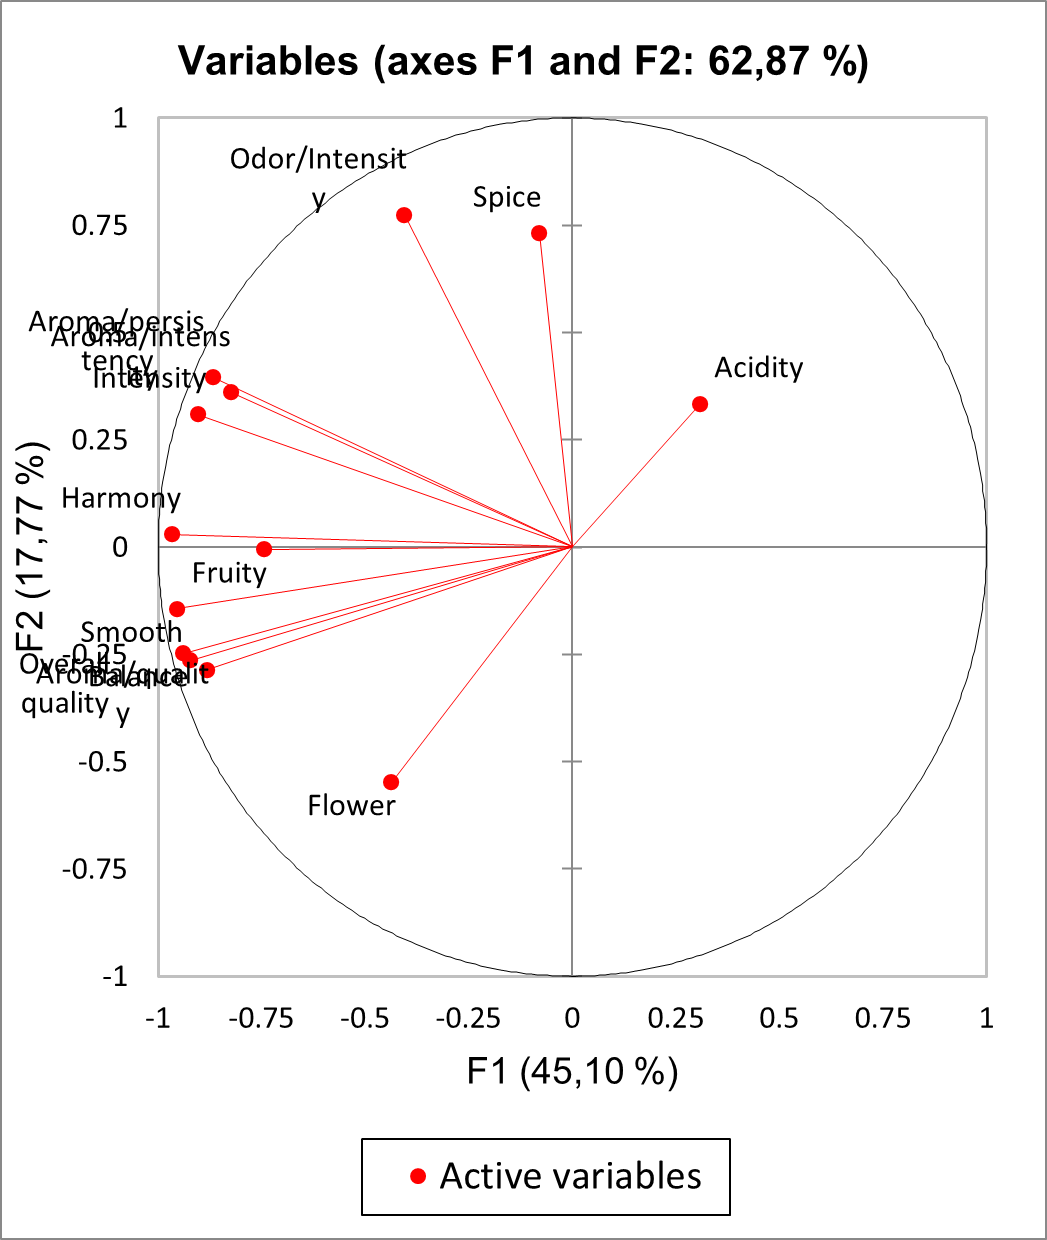
- Correlation chart: shows the correlations between the components and the quantitative variables on a circle of radius one. NB : If the PCA was not standardized, we would study the covariance matrix instead of the correlation one and we could not display a circle of radius one.
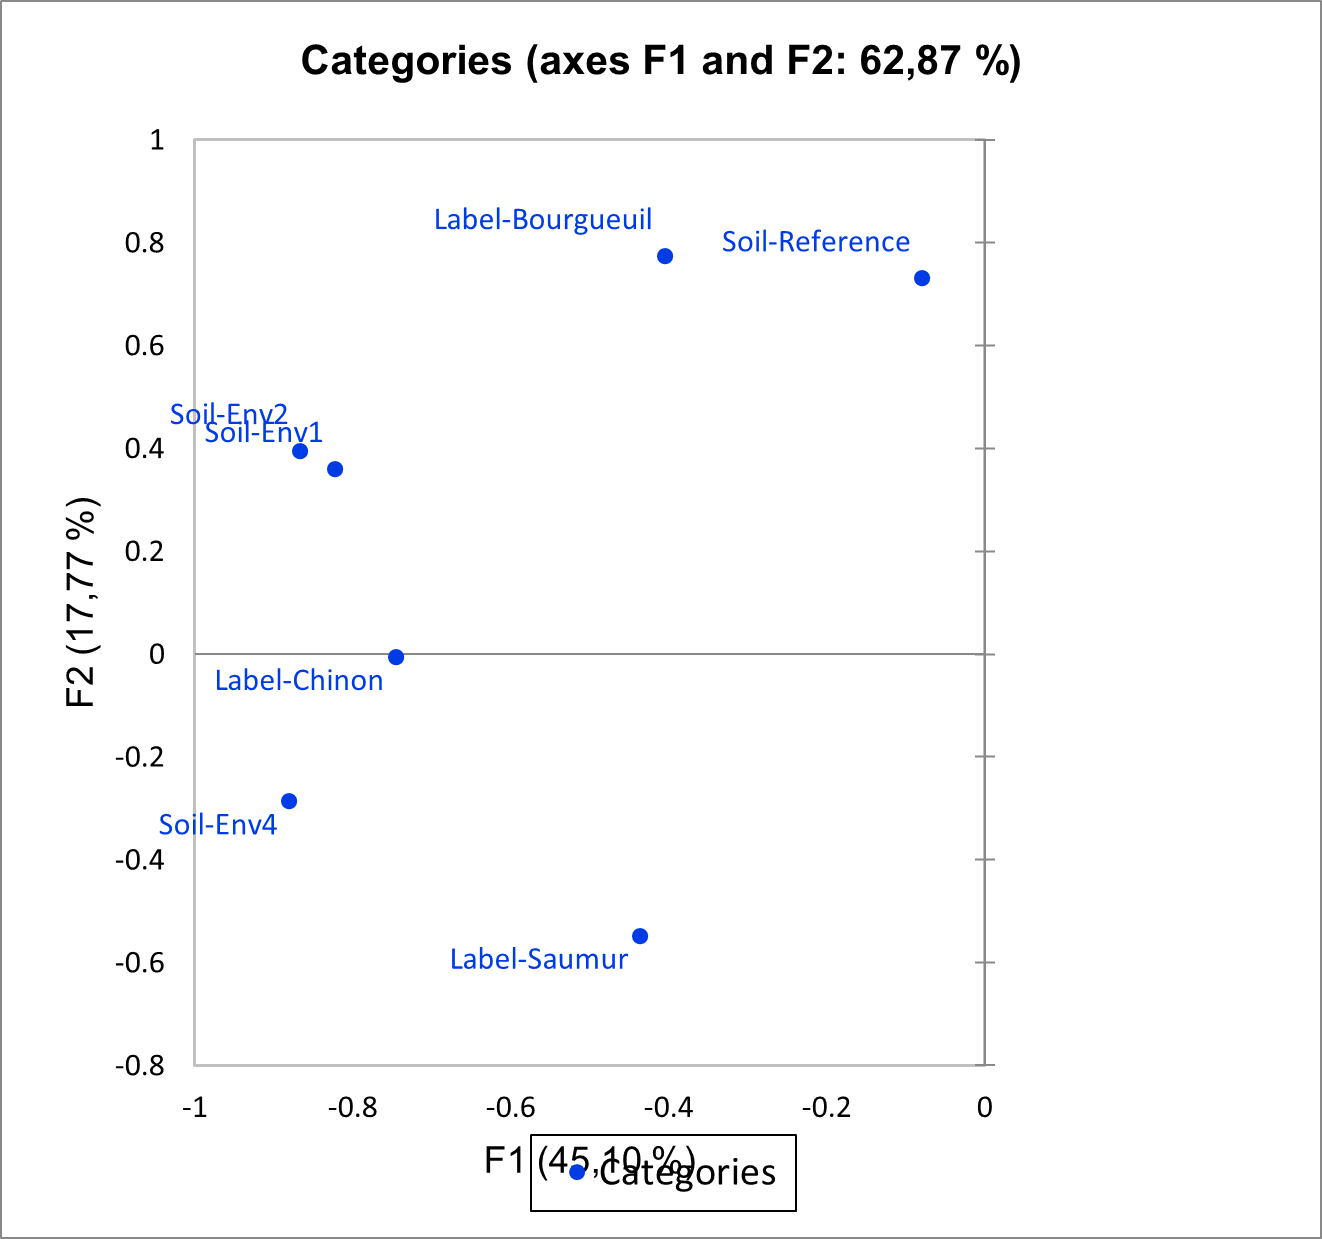
- Factorial map of categories: shows the principal coordinates of categories of active and supplementary qualitative variables.
- Mixed chart: mixed chart of squared loadings for quantitative and qualitative variables.
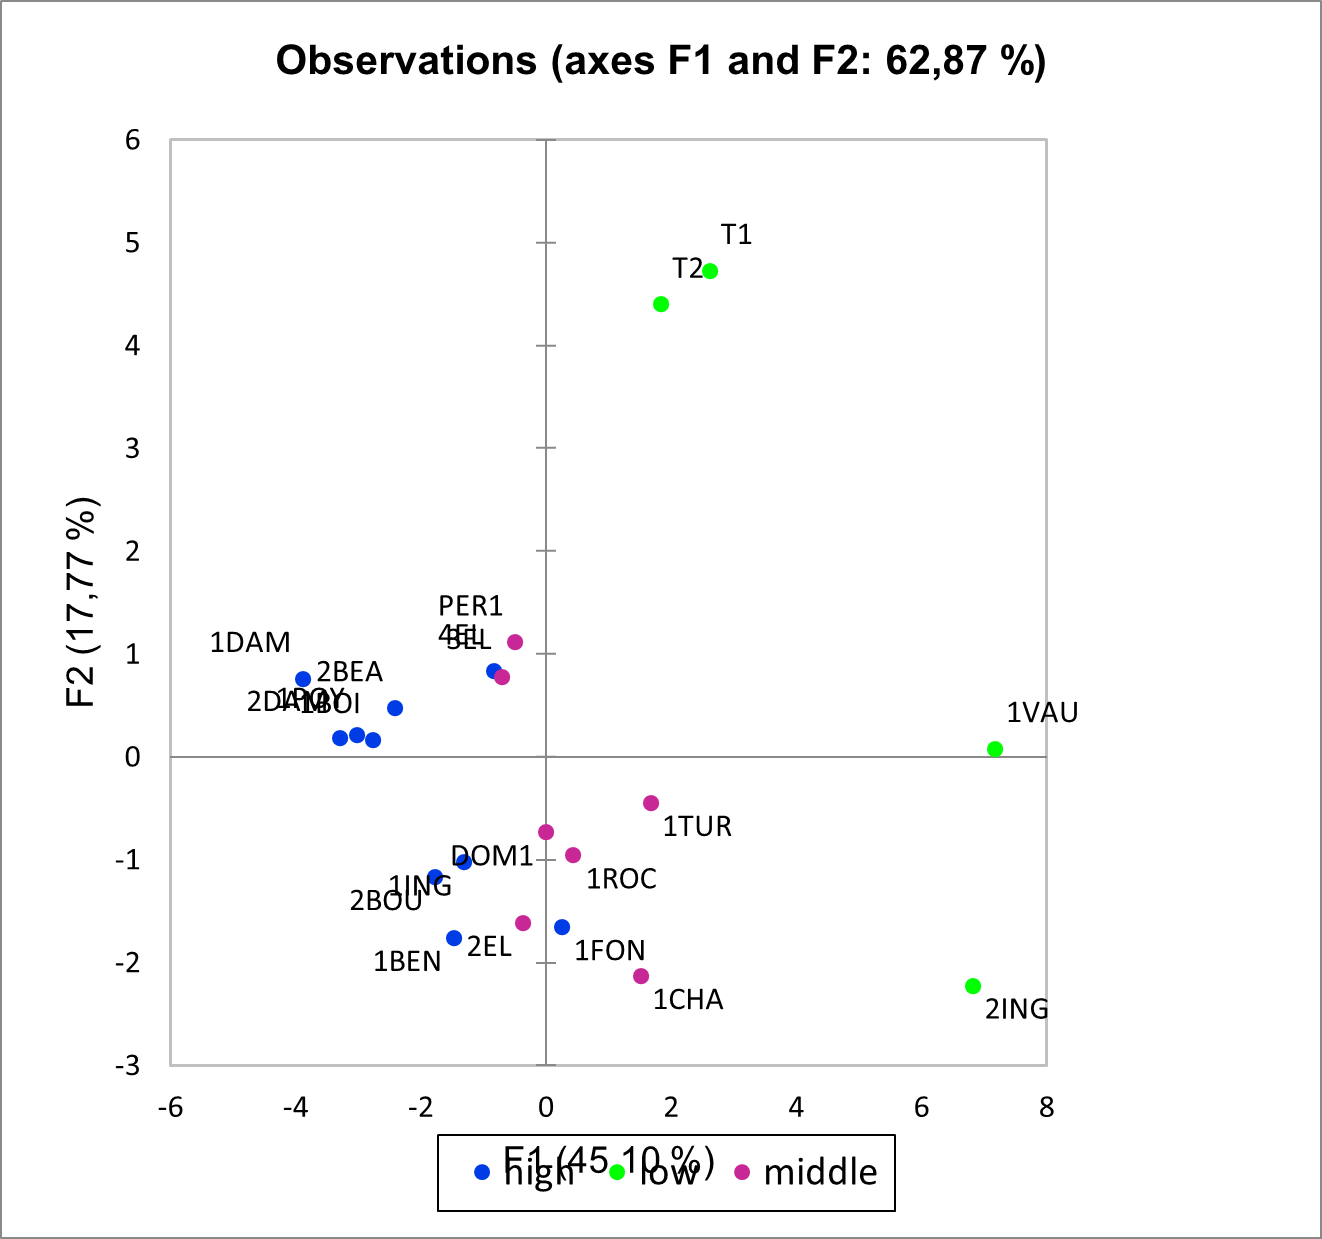
- Factorial map of observations: chart representing the principal coordinates of observations.
Here is an example on how to run a Factorial analysis of mixed data (PCAmix)


analyze your data with xlstat
Related features