Quantiles estimation
Quantiles estimation is useful for describing a distribution while minimizing the influence of outliers. Available in Excel using the XLSTAT software.

Quantiles and percentiles
Quantiles are defined by ordering data into q equally sized data subsets and noting the boundaries. The kth q-quantile for a random variable X is the value x such that the probability that the random variable will be less than x is at most k / q and the probability that the random variable will be more than x is at most (q − k) / q.
Let 0 < q < 1. The q-quantile of a variable X is given by:
P(X≤x)≥q and P(X≥x)≥1-q
There are q − 1 of the q-quantiles, one for each integer k satisfying 0 < k < q.
A percentile is a quantile based on a 0 to 100 scale.
The XLSTAT quantile feature
The XLSTAT quantile tool calculates quantiles and displays univariate plots for a set of quantitative variables. XLSTAT offers you five methods to calculate quantiles.
While you can select several samples at the same time, XLSTAT calculates all the descriptive statistics for each sample independently.
Quantiles are useful because they are less sensitive to outliers and skewed distributions.
Confidence interval for quantiles
You can obtain confidence intervals associated to the quantiles. Two intervals are available:
- Confidence interval based on the normal distribution
- Distribution free confidence interval
Additional available plots
In addition to the quantile plots, XLSTAT gives you the possibility to plot several charts:
- Cumulative histogram
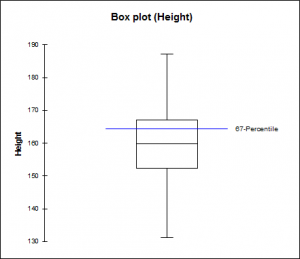
- Box plot
- Scattergrams: These univariate representations give an idea of the distribution and possible plurality of the modes of a sample. All points are represented together with the median.


analyze your data with xlstat
Related features