Multidimensional Scaling (MDS)
Multidimensional Scaling (MDS) helps visualizing a proximity matrix between objects. Run MDS or NMDS in Excel using the XLSTAT add-on statistical software.

What is Multidimensional Scaling
Multidimensional Scaling (MDS) is used to go from a proximity matrix (similarity or dissimilarity) between a series of N objects to the coordinates of these same objects in a p-dimensional space. p is generally fixed at 2 or 3 so that the objects may be visualized easily.
For example, with MDS, it is possible to reconstitute the position of towns on a map very precisely from the distances in kilometers (the dissimilarity in this case being the Euclidean distance) between the towns, modulo a rotation and a symmetrical transformation. Practically, MDS is often used in psychometry (perception analysis) and marketing (distances between products obtained from consumer classifications) but there are applications in a large number of domains.
Types of Multidimensional Scaling: MDS and NMDS
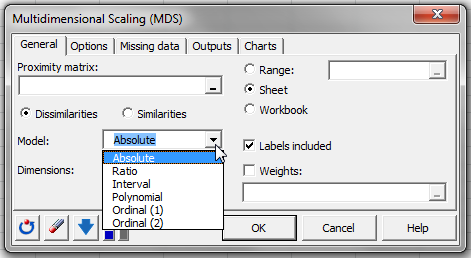
There are two types of MDS depending on the nature of the dissimilarity observed: metric and non metric MDS. All the following options are available in XLSTAT.
Metric MDS
With Metric MDS, the dissimilarities are considered as continuous and giving exact information to be reproduced as closely as possible. There are 4 sub-models in XLSTAT:
- Absolute MDS: the distances obtained in the representation space must correspond as closely as possible to the distances observed in the starting dissimilarity matrix.
- Ratio MDS: the distances obtained in the representation space must correspond as closely as possible to the distances observed in the initial matrix using a near proportionality factor (the factor being identical for all pairs of distances).
- Interval MDS: the distances obtained in the representation space must correspond as closely as possible to the distances observed in the initial matrix using a near linear relationship (the linear relationship being identical for all pairs of distances).
- Polynomial MDS: the distances obtained in the representation space must correspond as closely as possible to the distances observed in the initial matrix using a near 2nd-degree polynomial relationship (the polynomial relationship being identical for all pairs of distances).
Note: the absolute model is used to compare distances in the representation space with those in the initial space. The other models have the advantage of speeding up the calculations.
Non metric MDS or NMDS
With Non metric MDS or NMDS, only the order of the dissimilarities counts. In other words, the MDS algorithm does not have to try to reproduce the dissimilarities but only their order. Two models are available:
- Ordinal (1): the order of the distances in the representation space must correspond to the order of the corresponding dissimilarities. If there are two dissimilarities of the same rank, then there are no restrictions on the corresponding distances. In other words, dissimilarities of the same rank need not necessarily give equal distances in the representation space.
- Ordinal (2): the order of the distances in the representation space must correspond to the order of the corresponding dissimilarities. If dissimilarities exist in the same rank, the corresponding distances must be equal.
The MDS algorithms aim to reduce the difference between the disparity matrix from the models and the distance matrix obtained in the representation configuration. For the absolute model, the disparity is equal to the dissimilarity of the starting matrix.
Note: for a given number of dimensions, the weaker the stress, the better the quality of the representation. Furthermore, the higher the number of dimensions, the weaker the stress.
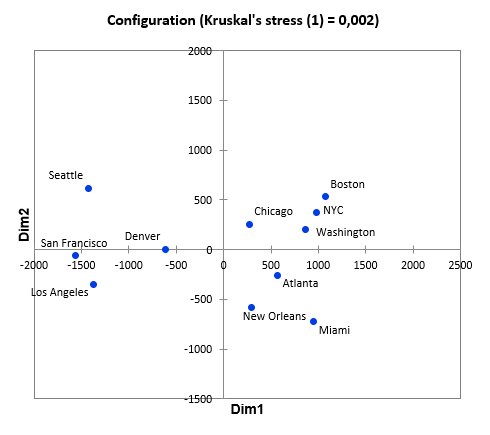
To find out whether the result obtained is satisfactory and to determine which is the correct number of dimensions needed to give a faithful representation of the data, the evolution in the stress with the number of dimensions and the point from which the stress stabilizes may be observed. The Shepard diagram is used to observe any ruptures in the ordination of the distances. The more the chart looks linear, the better the representation. For the absolute model, for an ideal representation, the points must be aligned along the first bisector.
There are several MDS algorithms including, in particular, ALSCAL (Takane et al. 1977) and SMACOF (Scaling by MAjorizing a COnvex Function ) which minimizes the "Normalized Stress" (de Leeuw, 1977). XLSTAT uses the SMACOF algorithm.
Multidimensional Scaling results in XLSTAT
- Stress after minimization: This table shows the final stress obtained, the number of iterations required and the level of convergence reached for the dimensions considered. Where multiple dimensions were considered, a chart is displayed showing the stress evolution as a function of the number of dimensions.
The following results are displayed for each of the considered dimensions:
- Distances measured in the representation space: This table shows the distances between objects in the representation space.
- Disparities computed using the model: This table shows the disparities calculated according to the model chosen (absolute, interval, etc.).
- Residual distances: These distances are the difference between the dissimilarities of the starting matrix and the distances measured in the representation space.
- Comparative table: This table is used to compare dissimilarities, disparities and distances and the ranks of these three measurements for all paired combinations of objects.
Multidimensional Scaling charts in XLSTAT
- Shepard diagram: This chart compares the disparities and the distances to the dissimilarities. For a metric model, the representation is better the more the points are aligned with the first bisector of the plan. For a non-metric model, the model is better the more regularly the line of dissimilarities/disparities increases. Furthermore, the performance of the model can be evaluated by observing if the (dissimilarity/distance) points are near to the (dissimilarity/disparity) points.
- MDS configuration: This table shows the coordinates of objects in the representation space. If this is a two-dimensional space, a graphic representation of the configuration is provided. If you have XLSTAT-3DPlot, you can also display a three-dimensional configuration.
Multidimensional Scaling tutorial in XLSTAT
This tutorial will help you set up and interpret a Multidimensional Scaling in Excel using XLSTAT.


analyze your data with xlstat
Related features