XLSTAT version 2022.1 - Data Mining
XLSTAT 2022.1 offers new possibilities for exploratory data analysis and clustering — whatever your field is.
Discover what’s new in XLSTAT!
Detrended Correspondence analysis
What is detrended correspondence analysis?
Detrended Correspondence Analysis, proposed by Hill and Gauch (1980), is an alternative to Classical Correspondence Analysis (CA) which studies the association between two qualitative variables in specific cases.
How can we use it?
This popular multivariate analysis tool is widely used to explore potentially sparse community data matrices in ecology. Its aim is to correct two drawbacks encountered when using classical CA: the “arc effect” and the tendency of CA to compress the distances between the points on the ends of the axes.
What's new in detrended correspondence analysis?
- In the Options tab of the Correspondence Analysis dialog box , you’ll find the new option for Detrended correspondence analysis under the Advanced analysis field. If you select this option you may then enter the parameters that are useful for the calculations, i.e. the number of segments to cut the axes and the number of rescalings to perform. By default, the number of segments is set to 26 and the number of rescalings is set to 4.
- In the same tab, you’ll also find a new option for Rotation: it is now possible to apply a rotation to one of the principal coordinate matrices using the “Quartimin" or “Varimax” method.
Access this new feature under the Analyzing data menu (all XLSTAT solutions)
Patterns of missing values
What is missing data imputation?
Imputation methods allow you to complete or clean your dataset before running an analysis. Different methods are available in the XLSTAT Missing data tool.
How can we use it?
For example, in surveys, you may get empty responses or values like “none” and “99” as respondents often skip questions. Such values must either either be removed or imputed, depending on the type of variables and the modeling purpose.
What's new in patterns of missing values?
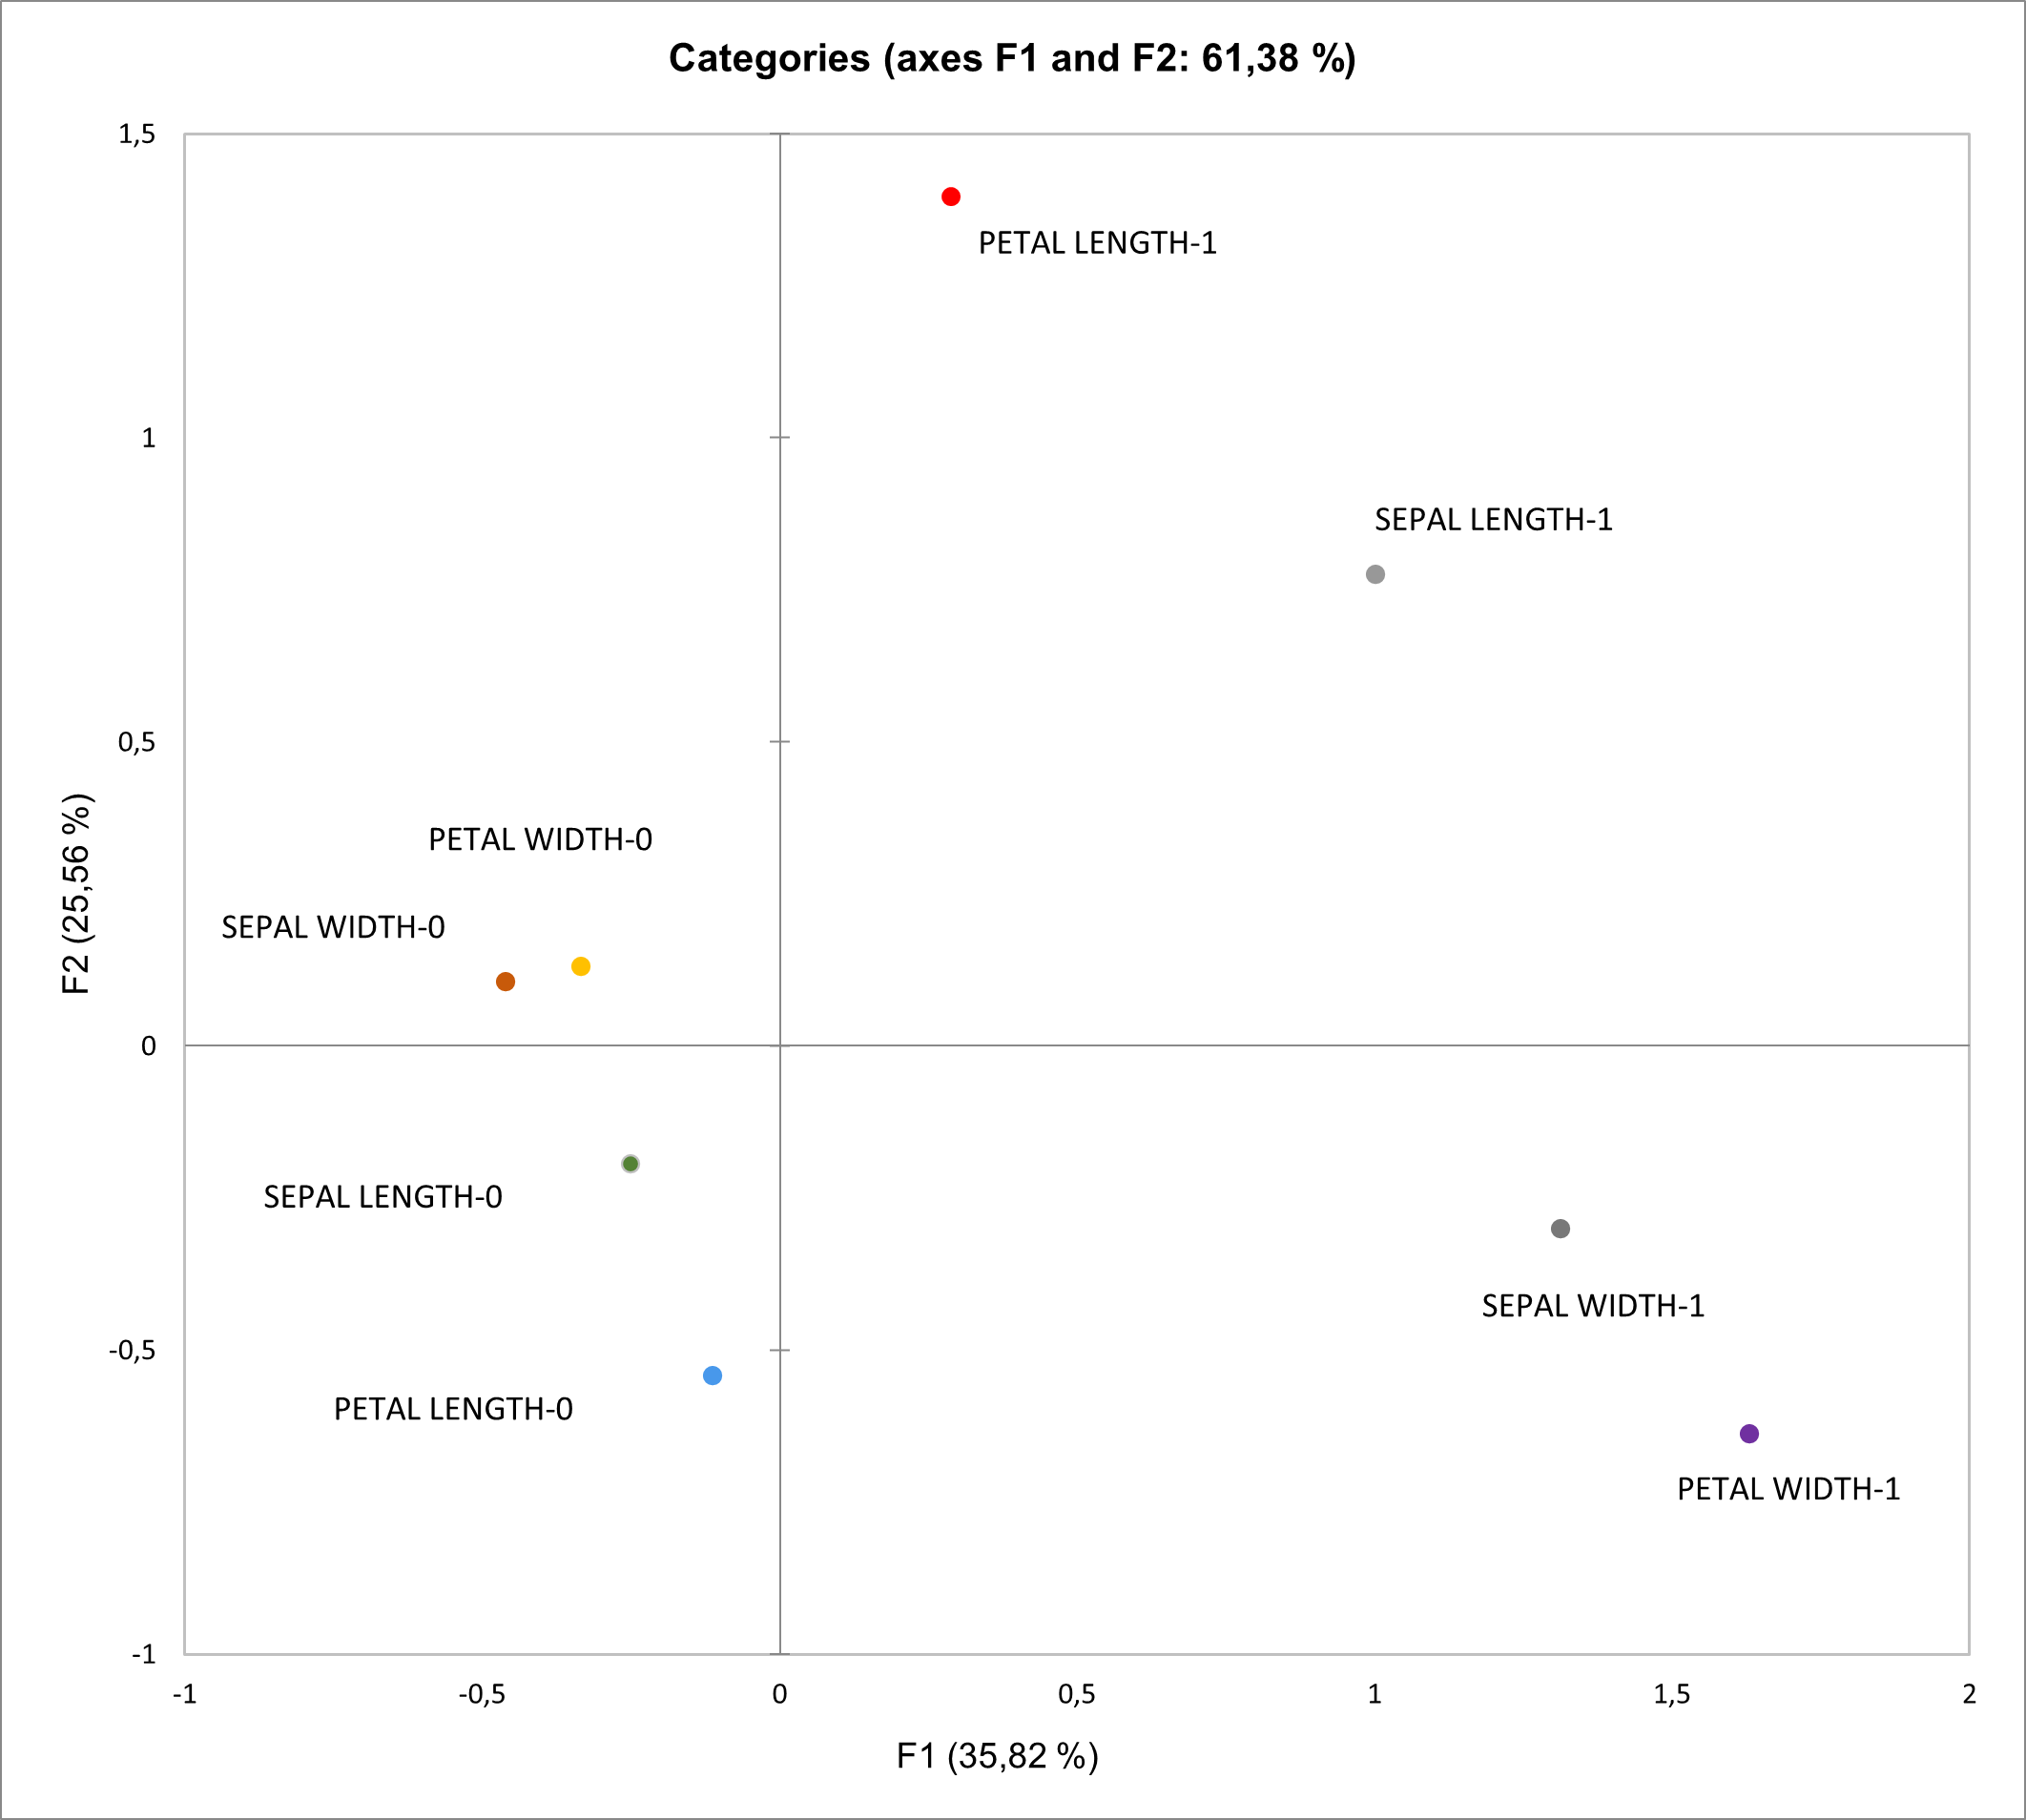
In this version, we’ve added a new option in the Missing data dialog box that helps you better understand the patterns of missing values within a data set. To accomplish this, a multiple correspondence analysis (MCA) is performed. In the output sheet, a factorial map is displayed that illustrates the links between variables with missing data and those without missing data.
Access this new feature under the Preparing data menu (all XLSTAT solutions)
k-means clustering
What is k-means clustering?
K-means clustering is an unsupervised machine learning algorithm that is designed to solve classification problems. It has numerous advantages, such as:
- An object can be assigned to a class in one iteration and then change class in the next iteration, which is impossible with Agglomerative Hierarchical Clustering (AHC).
- By multiplying the starting points and the repetitions, several solutions may be explored.
How can we use it?
This popular exploratory data analysis technique can be used in customer segmentation, insurance fraud detection, document clustering, image segmentation and many other applications.
Check out this tutorial, where we try to create homogeneous clusters of US states based on demographic data.
What's new in k-means clustering?
- Two additional dissimilarity indexes are available (general tab). The Cosine dissimilarity is recommended for analyzing textual data. The Jaccard index is recommended for datasets that require a fine analysis.
- In the options tab, we have added the K++ and K|| algorithms in the Initial partition field. This defines the way objects are assigned to classes in the first iteration of the clustering algorithm.
- A prediction tab was added in order to identify the cluster of a new observation.
- Silhouette scores have been added to the output. This metric will help you to calculate the goodness of clustering algorithm.
Access this new feature under Machine Learning (all XLSTAT solutions except Basic)
Univariate clustering
What is Univariate clustering?
Univariate clustering is a data mining technique that aims to group individuals/objects based on a single variable.
How can we use it?
For example, you can use univariate clustering in sensory data analysis to create groups of consumers based on their evaluation of a product. You may also group cities according to their annual rainfall, cluster athletes into categories based on their performance, create groups of customers depending on their age, etc.
Check out our example on splitting a class of students into different study groups for each course depending on their grades
What's new in Univariate clustering?
The XLSTAT algorithm for Univariate Clustering has been optimized. Computations are quicker and more precise. Several fixes have been made.
Access this new feature under the Analyzing data menu (all XLSTAT solutions)
Discriminant Analysis of Principal Components
What is Discriminant Analysis of Principal Components ?
Discriminant analysis of principal components aims to identify and describe clusters of individuals. First, it runs a PCA and then an LDA on the principal components of the PCA.
How can we use it?
This new feature has been developed specifically for genetically structured populations. Here we have an example that describes clusters of individuals depending on the number of different alleles in their loci.
Access this new feature under the XLSTAT-R menu (all XLSTAT solutions except Basic)
How to get XLSTAT 2022.1?
Version 2022.1 will give you access to all the above improvements, advanced options and increase the performance of your software. Installing our new version is recommended for all users.
If you are currently using our trial version or have a valid license, you can download version 2022.1 for free at:
Latest tweets
No tweet to display