Two-sample t-test and z-test
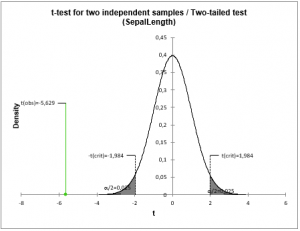
Two sample t and z tests are parametric tests used to compare two samples, independent or paired. Run them in Excel using the XLSTAT statistical software.

What are two-sample t-tests and z-tests?
Two-sample t-test and z-test are popular parametric tests in statistics. These methods are widely used when it comes to inferential statistics and enable to test a general hypothesis called the null hypothesis.
Hypothesis testing is an important concept in statistics. The Z-test and Student's t-test are used to determine the significance level of a set of data. These two tests are used to compare the means of two samples, in other words, they allow us to test the null hypothesis of equality of the means of two groups (samples).
The calculation method differs according to the nature of the samples. A distinction is made between independent samples or paired samples. The t and z tests are known as parametric because the assumption is made that the samples are normally distributed.
XLSTAT provides a complete and flexible two-sample t-tests and z-tests feature that proposes several standard and advanced options that will let you gain a deep insight on your data:
- Run a two-sample test for independent or paired samples
- Choose between three different alternative hypotheses
- Choose the Monte-Carlo method or the asymptotic p-value method for the computation of the p-value
- Use an F-test to test the equality of variances and help you choose between the t-test and the z-test
- Display dominance diagrams to make a visual comparison of the samples
What is the difference between a two-sample t-test and a z-test?
Here are the differences between the two-sample t-test and z-test:
- The t-test is used to compare and analyze whether the means of two populations are different from each other when the standard deviation is not known. The Z-test, on the other hand, is a parametric test to determine if the means of two data sets differ from each other and is applied when the standard deviation is known.
- The t-test is based on the Student's t-distribution, while the z-test is based on the assumption that the distribution of the sample means is normal.
- In the case of a t-test, the population variance must be unknown. However, the population variance must be known or assumed to be known in the case of a z-test.
- The z-test is used when the sample size is large (n > 30) while the t-test is appropriate when the sample size is small (n < 30).
When to use a two-sample t and z test?
Student's t Test
The use of Student's t test requires a decision to be taken beforehand on whether variances of the samples are to be considered equal or not. XLSTAT gives the option of using Fisher's F test to test the null hypothesis of equality of the variances of the groups (samples) and to use the result of the test in the subsequent calculations. If we consider that the two samples have the same variance, the common variance is estimated by:
s² = [(n1-1)s1² + (n2-1)s2²] / (n1 + n2 - 2)
Where s1 is the standard deviation of the first sample (group) and s2 is the standard deviation of the second sample.
The test statistic is therefore given by:
t = (µ1 - µ2 -D) / (s √1/n1 + 1/n2)
The t statistic follows a Student distribution with n1+n2-2 degrees of freedom.
If we consider that the variances are different, the statistic is given by:
t = (µ1 - µ2 -D) / (√s1²/n1 + s2²/n2)
z-Test
For the z-test, the variance s² of the population is presumed to be known. The user can enter this value or estimate it from the data (this is offered for teaching purposes only). The test statistic is given by:
z = (µ1 - µ2 -D) / (σ √1/n1 + 1/n2)
The z statistic follows a normal distribution.
Comparison of the means of two paired samples
If two samples are paired, they have to be of the same size. Where values are missing from certain observations, either the observation is removed from both samples or the missing values are estimated.
We study the mean of the calculated differences for the n observations. If d is the mean of the differences, s² the variance of the differences and D the supposed difference, the statistic of the t test is given by:
T= (d-D) ⁄ (s/√n)
The t statistic follows a Student distribution with n-1 degrees of freedom.
For the z test, the statistic is as follows where σ² is the variance
z= (d-D) ⁄ (σ/√n)
The z statistic follows a normal distribution.
Alternative hypotheses
Three types of tests are possible, depending on the null hypothesis, and therefore on the alternative hypothesis chosen:
- two-tailed test,
- left-tailed test,
- right-tailed test.
Tutorials on how to run two-sample t-tests and z-tests using the XLSTAT software
Here are a few tutorials on how to use the Two-sample t-test and z-test feature:
- An example on how to run a Student's t-test on two independent samples
- An example on how to run a Student's t-test on two paired samples


analyze your data with xlstat
Related features