Data sampling
Use this tool to generate a subsample of observations from a set of univariate or multivariate data. Available in Excel using the XLSTAT add-on statistical software.

Use of data sampling
Sampling is one of the fundamental data analysis and statistical techniques. Sampling aims at extracting a sample of size n from a dataset.
Samples are generated to:
- Test an hypothesis on one sample, then test it on another;
- Obtain very small tables which have the properties of the original table.
To meet these different situations, several methods have been proposed.
XLSTAT data sampling options
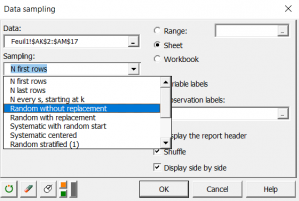
XLSTAT offers the following methods for generating a sample of N observations from a table of M rows:
- N first rows: The sample obtained is taken from the first N rows of the initial table.
- N last rows: The sample obtained is taken from the last N rows of the initial table. This method is only used if it is certain that the values have not been sorted according to a particular criterion which could introduce bias into the analysis
- N every s starting at k: The sample is built extracting N rows, every s rows, starting at row k
- Random without replacement: Observations are chosen at random and may occur only once in the sample
- Random with replacement: Observations are chosen at random and may occur several times in the sample
- Systematic from random start: From the j'th observation in the initial table, an observation is extracted every k observations to be used in the sample. j is chosen at random from among a number of possibilities depending on the size of the initial table and the size of the final sample. k is determined such that the observations extracted are as spaced out as possible
- Systematic centered: Observations are chosen systematically in the centers of N sequences of observations of length k
- Random stratified (1): Rows are chosen at random within N sequences of observations of equal length, where N is determined by dividing the number of observations by the requested sample size;
- Random stratified (2): Rows are chosen at random within N strata defined by the user. In each stratum, the number of sampled observations is proportional to the relative frequency of the stratum.
- Random stratified (3 ): Rows are chosen at random within N strata defined by the user. In each stratum, the number of sampled observations is proportional to a relative frequency supplied by the user.
- User defined: A variable indicates the frequency of each observation within the output sample.
- Training and test sets: Data are split into two parts – a training set and a test set. The rows of each set are randomly drawn from the initial dataset. The size of the training set is defined by a number of rows.
- Training and test sets (%): Data are split into two parts – a training set and a test set. The rows of each set are randomly drawn from the initial dataset. The size of the training set is defined by a row number percentage from the initial data set.


analyze your data with xlstat
14-day free trial