Spektralanalyse
Spectral analysis investigates the distribution of frequency components of a time series. Available in Excel using the XLSTAT add-on statistical software.

Spectral analysis
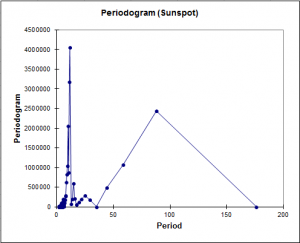
Spectral analysis allows transforming a time series into its coordinates in the space of frequencies, and then to analyze its characteristics in this space. The magnitude and phase can be extracted from the coordinates. It is then possible to build representations such as the periodogram or the spectral density, and to test if the series is stationary. By studying the spectral density, seasonal components and/or noise can be identified. Spectral analysis is a very general method used in a variety of domains.
The spectral representation of a time series Xt, (t=1,…,n), decomposes Xt into a sum of sinusoidal components with uncorrelated random coefficients. From there we can obtain decomposition the autocovariance and autocorrelation functions into sinusoids.
Spectral density
The spectral density corresponds to the transform of a continuous time series. However, we usually have only access to a limited number of equally spaced data, and therefore, we need to obtain first the discrete Fourier coordinates (cosine and sine transforms), and then the periodogram. From the periodogram, using a smoothing function, we can obtain a spectral density estimate which is a better estimator of the spectrum.
The spectral density estimate (or discrete spectral average estimator) of the time series Xt uses weights. The weights, are either fixed by the user, or determined by the choice of a kernel. XLSTAT suggests the use of the following kernels:
- Parzen
- Quadratic spectral
- Tukey-Hanning
- Truncated
White noise tests
XLSTAT optionally displays two test statistics and the corresponding p-values for white noise: Fisher's Kappa and Bartlett's Kolmogorov-Smirnov statistic.
Spectral analysis in XLSTAT
Using fast and powerful methods, XLSTAT automatically computes the Fourier cosine and sine transforms of Xt, for each Fourier frequency, and then the various functions that derive from these transforms.


analysieren sie ihre daten mit xlstat
Enthalten ind
Verwandte Funktionen