Factor analysis
Factor Analysis detects latent variables that summarize variability among several variables. Available in Excel with the XLSTAT statistical software.

What is Factor Analysis
Exploratory factor analysis (or EFA) is a method that reveals the possible existence of underlying factors which give an overview of the information contained in a very large number of measured variables. The structure linking factors to variables is initially unknown and only the number of factors may be assumed.
Latent factors used in Factor Analysis
Three methods of extracting latent factors are offered by XLSTAT:
- Principle components: This method is also used in Principle Component Analysis (PCA).
- Principal factors: This method is probably the most used. It is an iterative method which enables the communalities to be gradually converged. The calculations are stopped when the maximum change in the communalities is below a given threshold or when a maximum number of iterations is reached. The initial communalities can be calculated according to various methods.
- Maximum likelihood: This method assumes that the input variables follow a normal distribution.
Rotation for Factor Analysis
Once the results have been obtained, they may be transformed in order to make them more easy to interpret, for example by trying to arrange that the coordinates of the variables on the factors are either high (in absolute value), or near to zero.
XLSTAT provides three types of rotations:
- Orthogonal rotations: Varimax, Quartimax, Equamax, Parsimax and Orthomax.
- Oblique transformations: Quartimin and Oblimin.
- Promax: A mixed procedure that consists initially of a Varimax rotation followed by an oblique rotation.
Results for Factor Analysis in XLSTAT
- Correlation/Covariance matrix: This table shows the data to be used afterwards in the calculations. The significant correlations are displayed in bold.
- Cronbach's Alpha
- Maximum change in communality at each iteration: This table is used to observe the maximum change in communality for the last 10 iterations. For the maximum likelihood method, the evolution of a criterion which is proportional to the opposite of the likelihood maximum is also displayed.
- Goodness of fit test: The goodness of fit test is only displayed when the likelihood maximum method has been chosen.
- Reproduced correlation matrix: This matrix is the product of the factor loadings matrix with its transpose.
- Residual correlation matrix: This matrix is calculated as the difference between the variables correlation matrix and the reproduced correlation matrix.
- Eigenvalues: This table shows the eigenvalues associated with the various factors together with the corresponding percentages and cumulative percentages.
- Eigenvectors
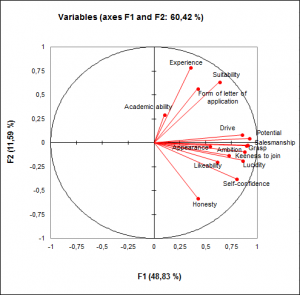
- Factor pattern: This table shows the factor loadings (coordinates of variables in the vector space, also called factor pattern). The corresponding chart is displayed.
- Factor/Variable correlations: This table displays the correlations between factors and variables.
- Factor pattern coefficients: This table displays the coefficients of the factor pattern to be displayed. Multiplying the (standardized) coordinates of the observations in the initial space by these coefficients gives the coordinates of the observations in the factor space.
Where a rotation has been requested, the results of the rotation are displayed with the rotation matrix first applied to the factor loadings. This is followed by the modified variability percentages associated with each of the axes involved in the rotation. The coordinates of the variables and observations after rotation are displayed in the following tables - Factor structure. This table shows the correlations between factors and variables after rotation.
Charts for Factor Analysis in XLSTAT
- Variables charts: These plots display the variables in the new space. The initial variables can be represented in the form of vectors.
- Correlations charts: These plots show the correlations between the factors and initial variables. Here also the initial variables can be shown in the form of vectors.
- Observations charts: These charts represent the observations in the new space.


analyze your data with xlstat
Related features