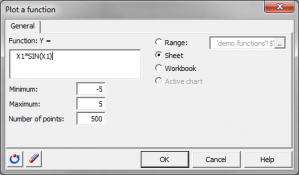
Plot a function
A quick and easy way to plot y = f(x) functions in Excel available with the XLSTAT add-on statistical software.

This tool allows you to plot a function of the type y = f (x) on an existing or new chart.
Plot functions from Microsoft Excel
The syntax of the function must respect the conventions imposed by Microsoft Excel for functions used in spreadsheets. In addition, the abscissa must be identified by X1.
Examples:
| Function | Syntax in XLSTAT |
|---|---|
Y=x² | X1^2 |
Y=ln(x) | LN(X1) |
Y=e(x) | EXP(X1) |
Y=|x| | ABS(X1) |
Y=x if x < 0, Y=2x if not | IF(X1 < 0,X1,2*X1) |
Plot XLSTAT functions
In addition, you can use as well XLSTAT worksheet functions. For example, to plot the normal cumulative distribution function, enter XLSTAT_CDFNormal (X1).


analyze your data with xlstat
14-day free trial