Data management
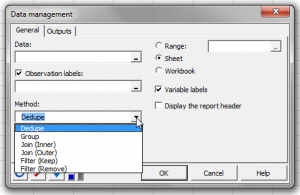
Data management techniques allow to tidy up datasets and make them ready for statistical analyses. Manage your data in Excel using the XLSTAT software.

Why do we need to manage data?
When information is coming from different sources it may be necessary to organize the data before starting an analysis.
XLSTAT offers several options for managing data.
Deduping
It is sometimes necessary to dedupe a table. Some observations might be mistakenly duplicated (or repeated) when they come from different sources, or because of input errors.
Grouping
Grouping is useful when you want to aggregate data. For example, imagine a table that contains all your sales records (one column with the customer id, and one with the sales value), that you want to transform to obtain one record per customer and the corresponding sum of sales. XLSTAT allows you to aggregate the data and to obtain the summary table within seconds. The sum is only one of the several available possibilities.
Joining
Joining is common task in database management. It allows to merge two tables "horizontally" on the basis of a common information named the "key". For example, imagine you measured some chemical indicators on 150 sites. Then you want to add geographical information on the sites where the data were collected. Your geographical table contains information on 1000 sites, including the 150 sites of interest. In order to avoid the tedious work of manually merging the two tables, a join will allow you to obtain within seconds the merged table that includes both the collected data and the geographical information. One distinguishes two main types of joining:
- Inner joins: The merged table includes only keys that are common to both input tables.
- Outer joins: The merged table includes all keys that are available in the first, the second or both input tables.
Filtering
Filtering is very useful when you want to treat only a part of your dataset. XLSTAT allows the possibility to apply a filter based on not only one value but on many values and give the option to keep or to remove the filtered data.

